| Param | Original file | Final file |
|---|---|---|
| Filename | modeM0/AS1T03_206T01_9000003672cztM0_level2_bc.evt | modeM0/AS1T03_206T01_9000003672cztM0_level2_quad_clean.evt |
| Size (bytes) | 15,684,877,440 | 4,321,074,240 |
| Size | 14.6 GB | 4.0 GB |
| Events in quadrant A | 75,256,915 | 27,731,916 |
| Events in quadrant B | 80,812,187 | 28,196,473 |
| Events in quadrant C | 103,195,014 | 26,342,563 |
| Events in quadrant D | 192,201,054 | 24,868,840 |
| Mode M9 | |||
|---|---|---|---|
| Quadrant | BADHDUFLAG | Total packets | Discarded packets |
| A | 0 | 570 | 0 |
| B | 0 | 571 | 0 |
| C | 0 | 571 | 0 |
| D | 0 | 571 | 0 |
| Mode SS | |||
|---|---|---|---|
| Quadrant | BADHDUFLAG | Total packets | Discarded packets |
| A | 0 | 7048 | 0 |
| B | 0 | 7048 | 0 |
| C | 0 | 7048 | 0 |
| D | 0 | 7048 | 0 |
| Mode M0 | |||
|---|---|---|---|
| Quadrant | BADHDUFLAG | Total packets | Discarded packets |
| A | 0 | 723311 | 0 |
| B | 0 | 746697 | 0 |
| C | 0 | 819915 | 0 |
| D | 0 | 1125604 | 0 |
| Quadrant | Total seconds | Saturated seconds | Saturation percentage |
|---|---|---|---|
| A | 346695 | 4512 | 1.301432% |
| B | 346696 | 5893 | 1.699760% |
| C | 346694 | 15659 | 4.516663% |
| D | 346694 | 23243 | 6.704183% |
Noise dominated data is calculated using 1-second bins in cleaned event files. If a bin has >2000 counts, and if more than 50% of those come from <1% of pixels, then it is considered to be noise-dominated and hence unusable.
| Quadrant | # 1 sec bins | Bins with >0 counts | Bins with >2000 counts | High rate bins dominated by noise | Noise dominated (total time) | Noise dominated (detector-on time) | Marked lightcurve |
|---|---|---|---|---|---|---|---|
| A | 412592 | 346684 | 118 | 118 | 0.03% | 0.03% |  |
| B | 412592 | 346680 | 167 | 167 | 0.04% | 0.05% |  |
| C | 412592 | 346696 | 3575 | 3575 | 0.87% | 1.03% |  |
| D | 412592 | 346664 | 4050 | 4050 | 0.98% | 1.17% | 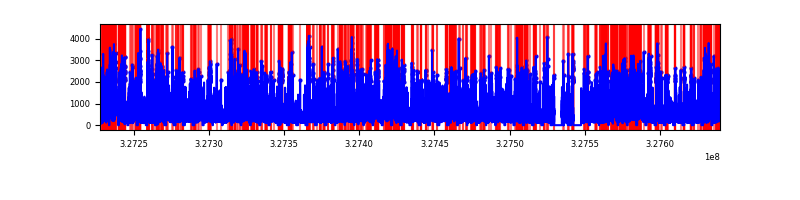 |
Top three noisy pixels from each quadrant. If the there are fewer than three noisy pixels in the level2.evt file, extra rows are filled as -1
| Pixel properties | Quadrant properties | ||||||
|---|---|---|---|---|---|---|---|
| Quadrant | DetID | PixID | Counts | Sigma | Mean | Median | Sigma |
| A | 10 | 17 | 912735 | 222.15 | 18725 | 18408 | 4025.8 |
| A | 11 | 208 | 569599 | 136.91 | 18725 | 18408 | 4025.8 |
| A | 13 | 254 | 554288 | 133.11 | 18725 | 18408 | 4025.8 |
| B | 0 | 190 | 1422418 | 398.72 | 18986 | 18529 | 3521.0 |
| B | 5 | 172 | 1389592 | 389.4 | 18986 | 18529 | 3521.0 |
| B | 0 | 229 | 1157657 | 323.53 | 18986 | 18529 | 3521.0 |
| C | 7 | 247 | 31848245 | 7659.64 | 17772 | 17721 | 4155.6 |
| C | 3 | 233 | 877975 | 207.01 | 17772 | 17721 | 4155.6 |
| C | 0 | 239 | 860666 | 202.84 | 17772 | 17721 | 4155.6 |
| D | 8 | 195 | 45466901 | 10921.73 | 17805 | 17180 | 4161.4 |
| D | 1 | 52 | 22430835 | 5386.08 | 17805 | 17180 | 4161.4 |
| D | 9 | 35 | 13385138 | 3212.37 | 17805 | 17180 | 4161.4 |
Histogram calculated using DETX and DETY for each event in the final _common_clean file
| Quadrant A |  |
 |
Quadrant B |
|---|---|---|---|
| Quadrant D |  |
 |
Quadrant C |
| Plot type | Count rate plots | Images |
|---|---|---|
| Comparison with Poisson distribution Blue bars denote a histogram of data divided into 1 sec bins. Red curve is a Poisson curve with rate = median count rate of data. |
 |
 |
| Quadrant-wise count rates Data is divided into 100 sec bins |
 |
|
| Module-wise count rates for Quadrant A Data is divided into 100 sec bins |
 |
 |
| Module-wise count rates for Quadrant B Data is divided into 100 sec bins |
 |
 |
| Module-wise count rates for Quadrant C Data is divided into 100 sec bins |
 |
 |
| Module-wise count rates for Quadrant D Data is divided into 100 sec bins |
 |
 |
| Parameter | Plot |
|---|---|
| CZT HV Monitor | 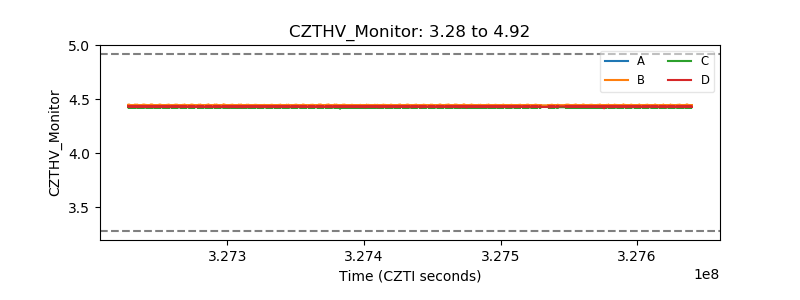 |
| D_VDD |  |
| Temperature 1 |  |
| Veto HV Monitor |  |
| Veto LLD |  |
| Alpha Counter |  |
| _CPM_Rate |  |
| CZT Counter | 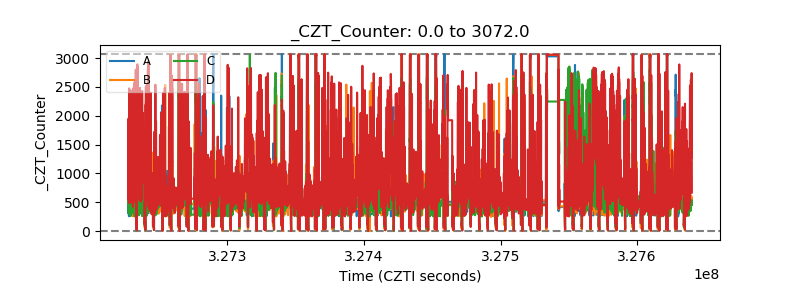 |
| +2.5 Volts monitor | 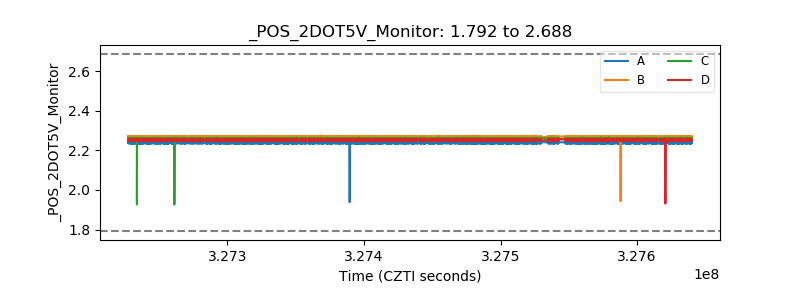 |
| +5 Volts monitor |  |
| _ROLL_ROT |  |
| _Roll_DEC |  |
| _Roll_RA |  |
| Veto Counter |  |