| Param | Original file | Final file |
|---|---|---|
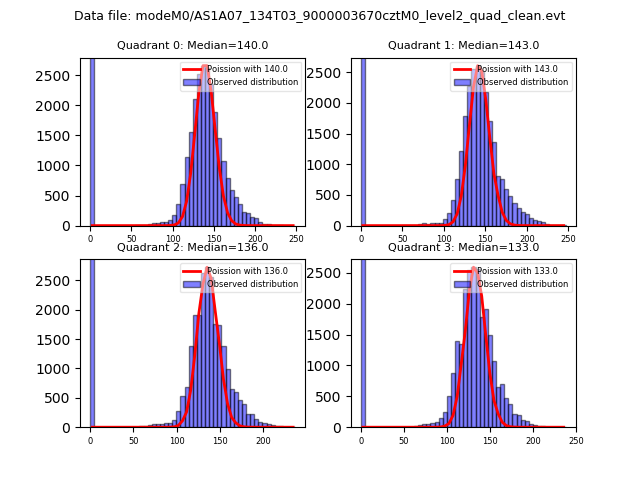
| Filename | modeM0/AS1A07_134T03_9000003670cztM0_level2_bc.evt | modeM0/AS1A07_134T03_9000003670cztM0_level2_quad_clean.evt |
| Size (bytes) | 1,773,233,280 | 529,024,320 |
| Size | 1.7 GB | 504.5 MB |
| Events in quadrant A | 8,274,824 | 3,406,075 |
| Events in quadrant B | 9,077,790 | 3,488,636 |
| Events in quadrant C | 12,032,881 | 3,316,936 |
| Events in quadrant D | 21,750,154 | 3,223,207 |
| Mode M9 | |||
|---|---|---|---|
| Quadrant | BADHDUFLAG | Total packets | Discarded packets |
| A | 0 | 69 | 0 |
| B | 0 | 69 | 0 |
| C | 0 | 69 | 0 |
| D | 0 | 69 | 0 |
| Mode M0 | |||
|---|---|---|---|
| Quadrant | BADHDUFLAG | Total packets | Discarded packets |
| A | 0 | 79419 | 0 |
| B | 0 | 83130 | 0 |
| C | 0 | 93212 | 0 |
| D | 0 | 123548 | 0 |
| Mode SS | |||
|---|---|---|---|
| Quadrant | BADHDUFLAG | Total packets | Discarded packets |
| A | 0 | 764 | 0 |
| B | 0 | 764 | 0 |
| C | 0 | 764 | 0 |
| D | 0 | 764 | 0 |
| Quadrant | Total seconds | Saturated seconds | Saturation percentage |
|---|---|---|---|
| A | 37690 | 564 | 1.496418% |
| B | 37690 | 752 | 1.995224% |
| C | 37690 | 1590 | 4.218626% |
| D | 37690 | 1951 | 5.176439% |
Noise dominated data is calculated using 1-second bins in cleaned event files. If a bin has >2000 counts, and if more than 50% of those come from <1% of pixels, then it is considered to be noise-dominated and hence unusable.
| Quadrant | # 1 sec bins | Bins with >0 counts | Bins with >2000 counts | High rate bins dominated by noise | Noise dominated (total time) | Noise dominated (detector-on time) | Marked lightcurve |
|---|---|---|---|---|---|---|---|
| A | 44686 | 37692 | 0 | 0 | 0.00% | 0.00% |  |
| B | 44686 | 37692 | 6 | 6 | 0.01% | 0.02% | 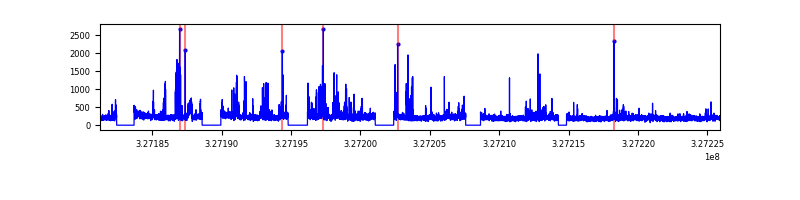 |
| C | 44686 | 37692 | 222 | 222 | 0.50% | 0.59% |  |
| D | 44686 | 37692 | 270 | 270 | 0.60% | 0.72% | 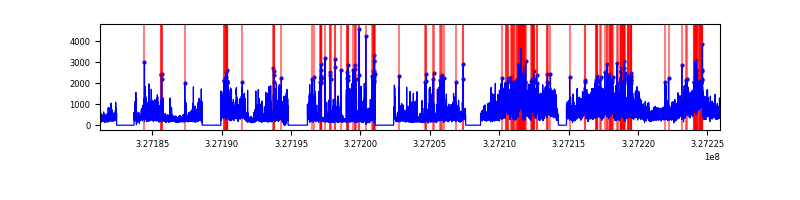 |
Top three noisy pixels from each quadrant. If the there are fewer than three noisy pixels in the level2.evt file, extra rows are filled as -1
| Pixel properties | Quadrant properties | ||||||
|---|---|---|---|---|---|---|---|
| Quadrant | DetID | PixID | Counts | Sigma | Mean | Median | Sigma |
| A | 11 | 208 | 74427 | 159.38 | 2129 | 2089 | 453.9 |
| A | 13 | 254 | 46743 | 98.38 | 2129 | 2089 | 453.9 |
| A | 0 | 226 | 13313 | 24.73 | 2129 | 2089 | 453.9 |
| B | 3 | 64 | 295363 | 732.43 | 2162 | 2118 | 400.4 |
| B | 4 | 80 | 218541 | 540.56 | 2162 | 2118 | 400.4 |
| B | 0 | 190 | 97206 | 237.5 | 2162 | 2118 | 400.4 |
| C | 7 | 247 | 3638019 | 7541.06 | 2068 | 2062 | 482.2 |
| C | 0 | 239 | 255867 | 526.4 | 2068 | 2062 | 482.2 |
| C | 2 | 16 | 147556 | 301.76 | 2068 | 2062 | 482.2 |
| D | 8 | 195 | 9117438 | 19258.6 | 2078 | 2010 | 473.3 |
| D | 1 | 52 | 4240312 | 8954.46 | 2078 | 2010 | 473.3 |
| D | 7 | 238 | 160107 | 334.02 | 2078 | 2010 | 473.3 |
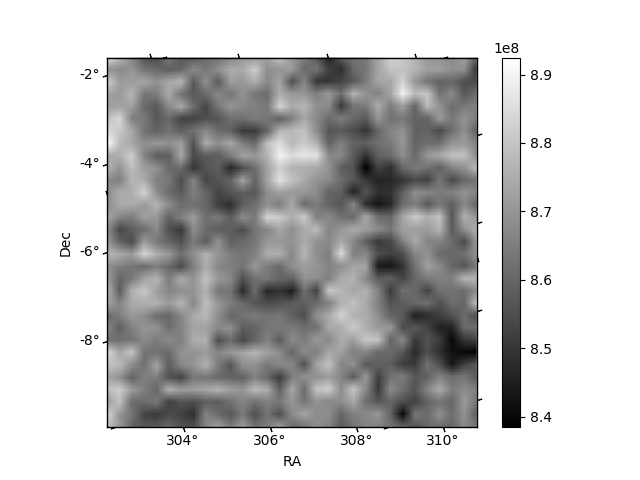
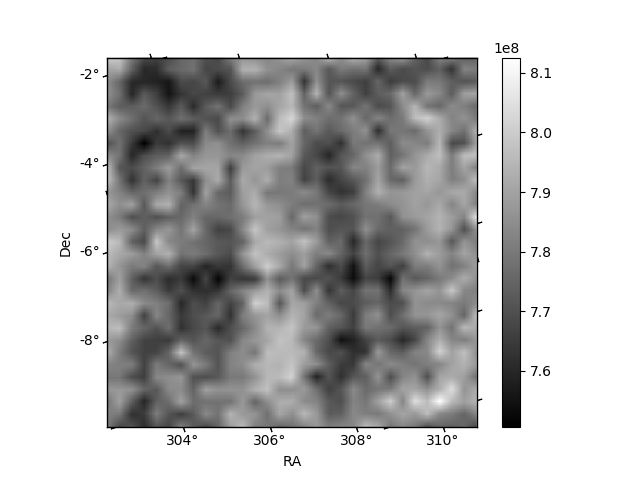
Histogram calculated using DETX and DETY for each event in the final _common_clean file
| Quadrant A |  |
 |
Quadrant B |
|---|---|---|---|
| Quadrant D |  |
 |
Quadrant C |
| Plot type | Count rate plots | Images |
|---|---|---|
| Comparison with Poisson distribution Blue bars denote a histogram of data divided into 1 sec bins. Red curve is a Poisson curve with rate = median count rate of data. |
 |
 |
| Quadrant-wise count rates Data is divided into 100 sec bins |
 |
|
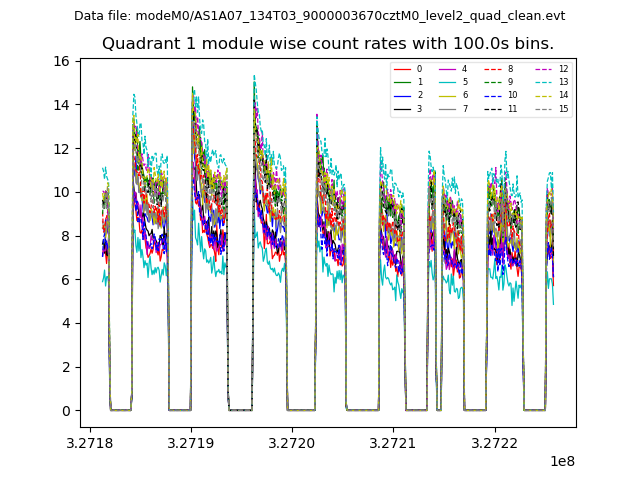
| Module-wise count rates for Quadrant A Data is divided into 100 sec bins |
 |
 |
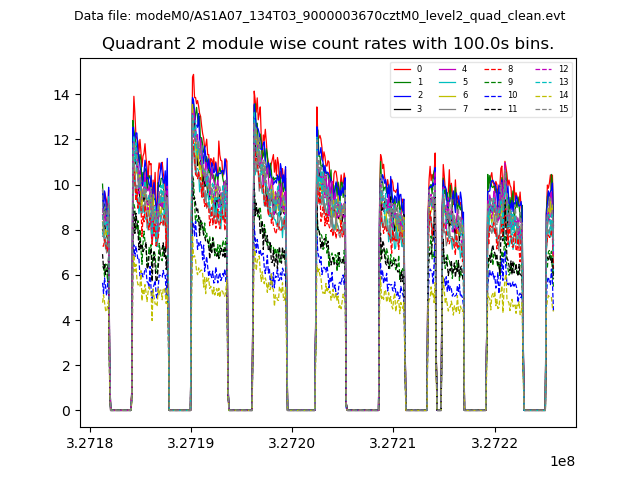
| Module-wise count rates for Quadrant B Data is divided into 100 sec bins |
 |
 |
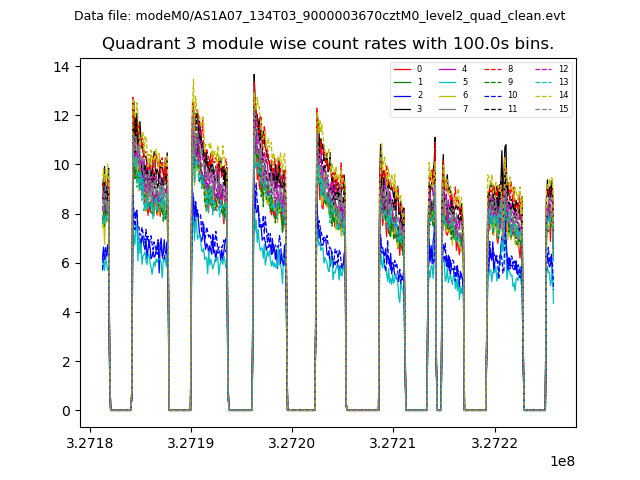
| Module-wise count rates for Quadrant C Data is divided into 100 sec bins |
 |
 |
| Module-wise count rates for Quadrant D Data is divided into 100 sec bins |
 |
 |
| Parameter | Plot |
|---|---|
| CZT HV Monitor |  |
| D_VDD |  |
| Temperature 1 |  |
| Veto HV Monitor | 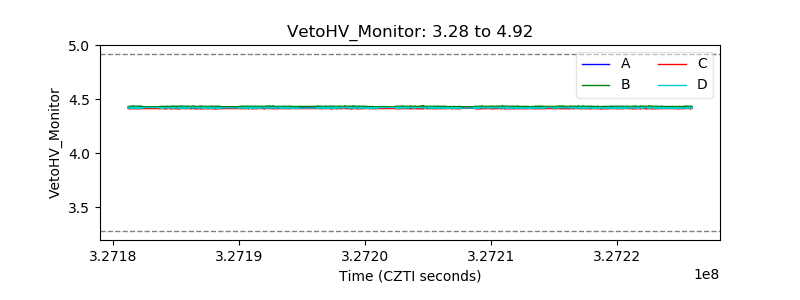 |
| Veto LLD |  |
| Alpha Counter |  |
| _CPM_Rate |  |
| CZT Counter | 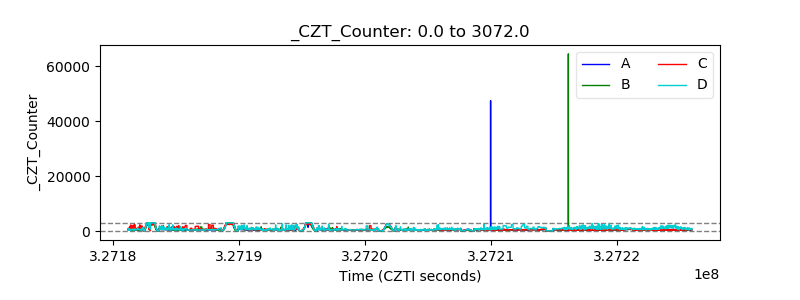 |
| +2.5 Volts monitor |  |
| +5 Volts monitor |  |
| _ROLL_ROT |  |
| _Roll_DEC |  |
| _Roll_RA |  |
| Veto Counter |  |