| Param | Original file | Final file |
|---|---|---|
| Filename | modeM0/AS1A07_027T11_9000003668cztM0_level2_bc.evt | modeM0/AS1A07_027T11_9000003668cztM0_level2_quad_clean.evt |
| Size (bytes) | 680,474,880 | 113,423,040 |
| Size | 649.0 MB | 108.2 MB |
| Events in quadrant A | 1,824,720 | 799,495 |
| Events in quadrant B | 1,925,299 | 814,067 |
| Events in quadrant C | 8,197,840 | 678,009 |
| Events in quadrant D | 8,086,622 | 561,852 |
| Mode M0 | |||
|---|---|---|---|
| Quadrant | BADHDUFLAG | Total packets | Discarded packets |
| A | 0 | 17699 | 0 |
| B | 0 | 18091 | 0 |
| C | 0 | 38247 | 0 |
| D | 0 | 37719 | 0 |
| Mode SS | |||
|---|---|---|---|
| Quadrant | BADHDUFLAG | Total packets | Discarded packets |
| A | 0 | 172 | 0 |
| B | 0 | 172 | 0 |
| C | 0 | 172 | 0 |
| D | 0 | 172 | 0 |
| Mode M9 | |||
|---|---|---|---|
| Quadrant | BADHDUFLAG | Total packets | Discarded packets |
| A | 0 | 21 | 0 |
| B | 0 | 21 | 0 |
| C | 0 | 21 | 0 |
| D | 0 | 21 | 0 |
| Quadrant | Total seconds | Saturated seconds | Saturation percentage |
|---|---|---|---|
| A | 8345 | 93 | 1.114440% |
| B | 8345 | 106 | 1.270222% |
| C | 8345 | 2126 | 25.476333% |
| D | 8345 | 2874 | 34.439784% |
Noise dominated data is calculated using 1-second bins in cleaned event files. If a bin has >2000 counts, and if more than 50% of those come from <1% of pixels, then it is considered to be noise-dominated and hence unusable.
| Quadrant | # 1 sec bins | Bins with >0 counts | Bins with >2000 counts | High rate bins dominated by noise | Noise dominated (total time) | Noise dominated (detector-on time) | Marked lightcurve |
|---|---|---|---|---|---|---|---|
| A | 10505 | 8345 | 0 | 0 | 0.00% | 0.00% | 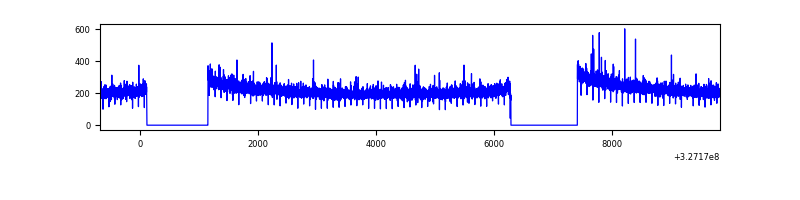 |
| B | 10505 | 8345 | 0 | 0 | 0.00% | 0.00% | 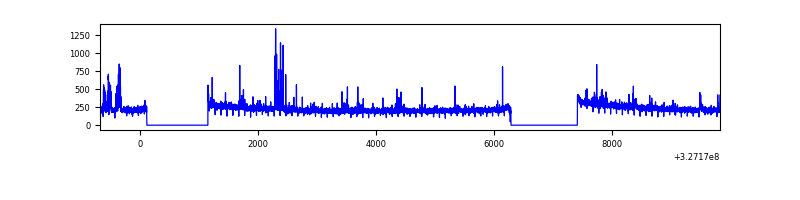 |
| C | 10505 | 8345 | 742 | 742 | 7.06% | 8.89% |  |
| D | 10505 | 8344 | 1847 | 1847 | 17.58% | 22.14% | 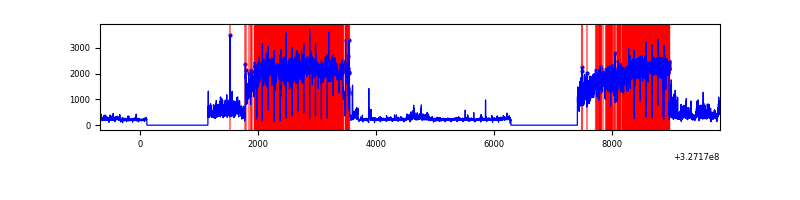 |
Top three noisy pixels from each quadrant. If the there are fewer than three noisy pixels in the level2.evt file, extra rows are filled as -1
| Pixel properties | Quadrant properties | ||||||
|---|---|---|---|---|---|---|---|
| Quadrant | DetID | PixID | Counts | Sigma | Mean | Median | Sigma |
| A | 13 | 254 | 10862 | 99.79 | 473 | 463 | 104.2 |
| A | 0 | 226 | 2999 | 24.33 | 473 | 463 | 104.2 |
| A | 6 | 16 | 2936 | 23.73 | 473 | 463 | 104.2 |
| B | 4 | 80 | 26162 | 284.72 | 477 | 466 | 90.3 |
| B | 0 | 245 | 20917 | 226.6 | 477 | 466 | 90.3 |
| B | 4 | 173 | 16881 | 181.88 | 477 | 466 | 90.3 |
| C | 7 | 247 | 6556433 | 65659.01 | 414 | 410 | 99.8 |
| C | 0 | 239 | 20030 | 196.5 | 414 | 410 | 99.8 |
| C | 7 | 226 | 16742 | 163.57 | 414 | 410 | 99.8 |
| D | 7 | 238 | 5925512 | 63406.33 | 395 | 380 | 93.4 |
| D | 8 | 195 | 595119 | 6364.45 | 395 | 380 | 93.4 |
| D | 2 | 234 | 30020 | 317.19 | 395 | 380 | 93.4 |
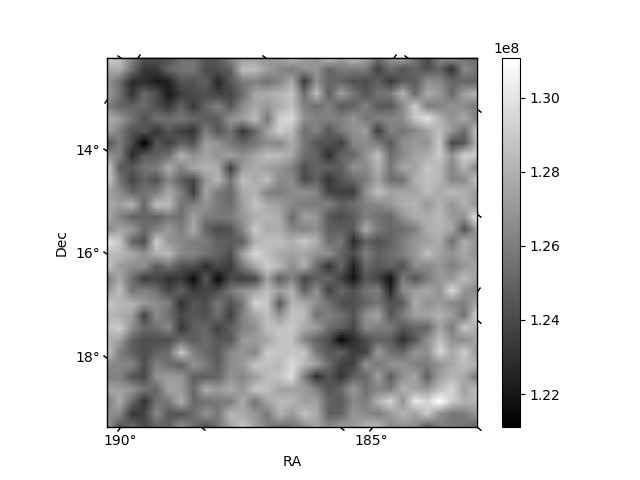
Histogram calculated using DETX and DETY for each event in the final _common_clean file
| Quadrant A |  |
 |
Quadrant B |
|---|---|---|---|
| Quadrant D |  |
 |
Quadrant C |
| Plot type | Count rate plots | Images |
|---|---|---|
| Comparison with Poisson distribution Blue bars denote a histogram of data divided into 1 sec bins. Red curve is a Poisson curve with rate = median count rate of data. |
 |
 |
| Quadrant-wise count rates Data is divided into 100 sec bins |
 |
|
| Module-wise count rates for Quadrant A Data is divided into 100 sec bins |
 |
 |
| Module-wise count rates for Quadrant B Data is divided into 100 sec bins |
 |
 |
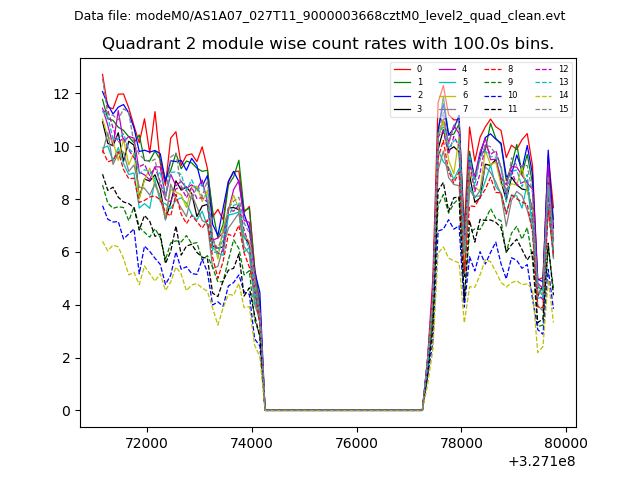
| Module-wise count rates for Quadrant C Data is divided into 100 sec bins |
 |
 |
| Module-wise count rates for Quadrant D Data is divided into 100 sec bins |
 |
 |
| Parameter | Plot |
|---|---|
| CZT HV Monitor |  |
| D_VDD |  |
| Temperature 1 |  |
| Veto HV Monitor |  |
| Veto LLD |  |
| Alpha Counter |  |
| _CPM_Rate | 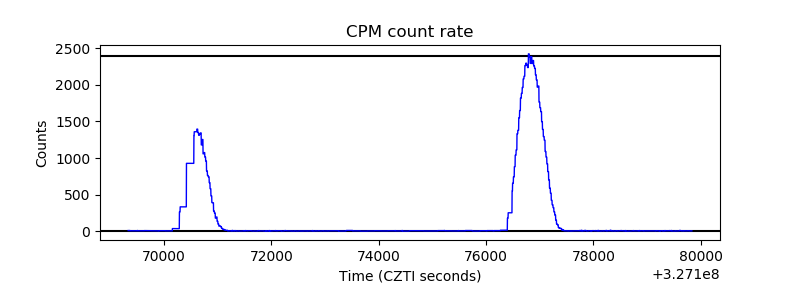 |
| CZT Counter |  |
| +2.5 Volts monitor |  |
| +5 Volts monitor |  |
| _ROLL_ROT |  |
| _Roll_DEC |  |
| _Roll_RA | 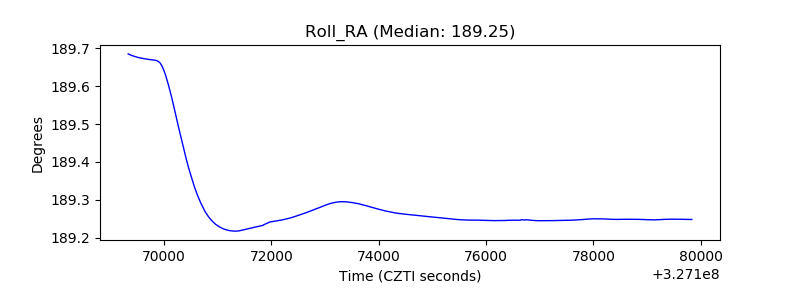 |
| Veto Counter |  |