| Param | Original file | Final file |
|---|---|---|
| Filename | modeM0/AS1A07_027T16_9000003666cztM0_level2_bc.evt | modeM0/AS1A07_027T16_9000003666cztM0_level2_quad_clean.evt |
| Size (bytes) | 3,021,027,840 | 780,085,440 |
| Size | 2.8 GB | 743.9 MB |
| Events in quadrant A | 11,586,846 | 5,120,322 |
| Events in quadrant B | 12,211,685 | 5,208,998 |
| Events in quadrant C | 45,586,468 | 4,601,909 |
| Events in quadrant D | 18,301,509 | 4,857,142 |
| Mode SS | |||
|---|---|---|---|
| Quadrant | BADHDUFLAG | Total packets | Discarded packets |
| A | 0 | 1136 | 0 |
| B | 0 | 1136 | 0 |
| C | 0 | 1136 | 0 |
| D | 0 | 1136 | 0 |
| Mode M9 | |||
|---|---|---|---|
| Quadrant | BADHDUFLAG | Total packets | Discarded packets |
| A | 0 | 76 | 0 |
| B | 0 | 76 | 0 |
| C | 0 | 76 | 0 |
| D | 0 | 76 | 0 |
| Mode M0 | |||
|---|---|---|---|
| Quadrant | BADHDUFLAG | Total packets | Discarded packets |
| A | 0 | 115082 | 0 |
| B | 0 | 117777 | 0 |
| C | 0 | 221802 | 0 |
| D | 0 | 139706 | 0 |
| Quadrant | Total seconds | Saturated seconds | Saturation percentage |
|---|---|---|---|
| A | 55921 | 640 | 1.144472% |
| B | 55921 | 905 | 1.618354% |
| C | 55921 | 12730 | 22.764257% |
| D | 55921 | 2185 | 3.907298% |
Noise dominated data is calculated using 1-second bins in cleaned event files. If a bin has >2000 counts, and if more than 50% of those come from <1% of pixels, then it is considered to be noise-dominated and hence unusable.
| Quadrant | # 1 sec bins | Bins with >0 counts | Bins with >2000 counts | High rate bins dominated by noise | Noise dominated (total time) | Noise dominated (detector-on time) | Marked lightcurve |
|---|---|---|---|---|---|---|---|
| A | 63496 | 55923 | 0 | 0 | 0.00% | 0.00% |  |
| B | 63496 | 55924 | 24 | 24 | 0.04% | 0.04% |  |
| C | 63495 | 55920 | 3938 | 3938 | 6.20% | 7.04% |  |
| D | 63496 | 55920 | 254 | 254 | 0.40% | 0.45% |  |
Top three noisy pixels from each quadrant. If the there are fewer than three noisy pixels in the level2.evt file, extra rows are filled as -1
| Pixel properties | Quadrant properties | ||||||
|---|---|---|---|---|---|---|---|
| Quadrant | DetID | PixID | Counts | Sigma | Mean | Median | Sigma |
| A | 6 | 16 | 76487 | 114.08 | 2978 | 2924 | 644.8 |
| A | 13 | 254 | 70294 | 104.48 | 2978 | 2924 | 644.8 |
| A | 0 | 226 | 18967 | 24.88 | 2978 | 2924 | 644.8 |
| B | 6 | 36 | 389217 | 692.98 | 3001 | 2935 | 557.4 |
| B | 0 | 190 | 122791 | 215.02 | 3001 | 2935 | 557.4 |
| B | 4 | 173 | 62827 | 107.44 | 3001 | 2935 | 557.4 |
| C | 7 | 247 | 34796824 | 53349.62 | 2736 | 2725 | 652.2 |
| C | 2 | 16 | 106303 | 158.81 | 2736 | 2725 | 652.2 |
| C | 7 | 226 | 98815 | 147.33 | 2736 | 2725 | 652.2 |
| D | 7 | 238 | 3850523 | 5639.54 | 2928 | 2830 | 682.3 |
| D | 1 | 52 | 1477951 | 2162.08 | 2928 | 2830 | 682.3 |
| D | 8 | 195 | 1201625 | 1757.07 | 2928 | 2830 | 682.3 |
Histogram calculated using DETX and DETY for each event in the final _common_clean file
| Quadrant A |  |
 |
Quadrant B |
|---|---|---|---|
| Quadrant D |  |
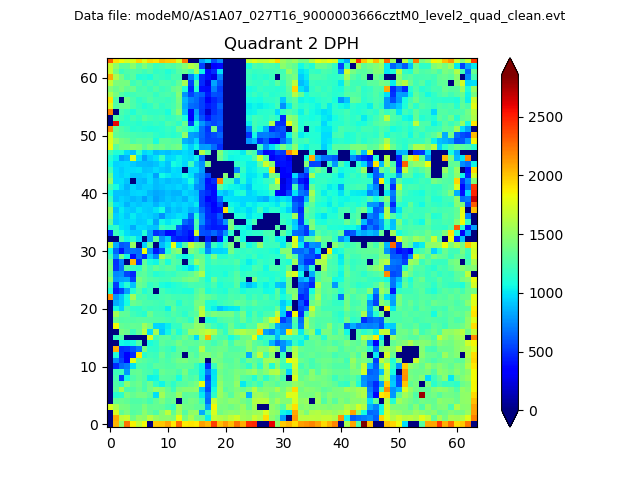 |
Quadrant C |
| Plot type | Count rate plots | Images |
|---|---|---|
| Comparison with Poisson distribution Blue bars denote a histogram of data divided into 1 sec bins. Red curve is a Poisson curve with rate = median count rate of data. |
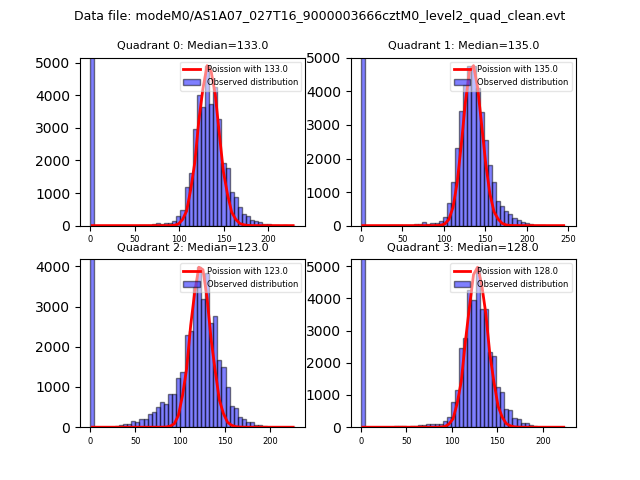 |
 |
| Quadrant-wise count rates Data is divided into 100 sec bins |
 |
|
| Module-wise count rates for Quadrant A Data is divided into 100 sec bins |
 |
 |
| Module-wise count rates for Quadrant B Data is divided into 100 sec bins |
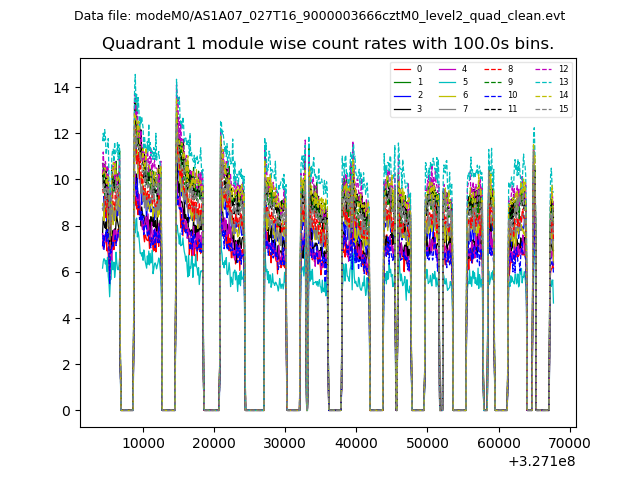 |
 |
| Module-wise count rates for Quadrant C Data is divided into 100 sec bins |
 |
 |
| Module-wise count rates for Quadrant D Data is divided into 100 sec bins |
 |
 |
| Parameter | Plot |
|---|---|
| CZT HV Monitor |  |
| D_VDD | 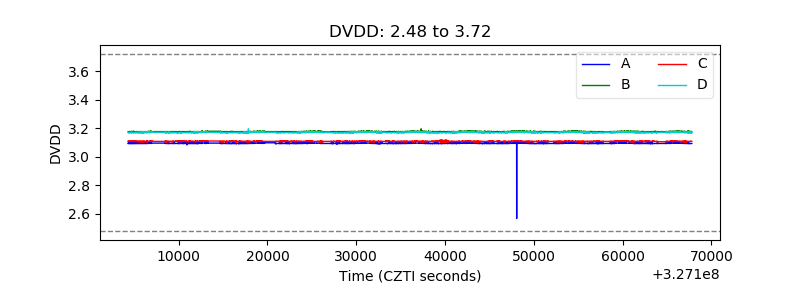 |
| Temperature 1 |  |
| Veto HV Monitor |  |
| Veto LLD | 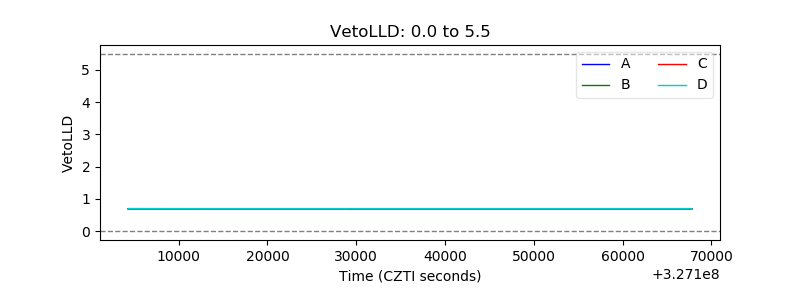 |
| Alpha Counter |  |
| _CPM_Rate |  |
| CZT Counter |  |
| +2.5 Volts monitor | 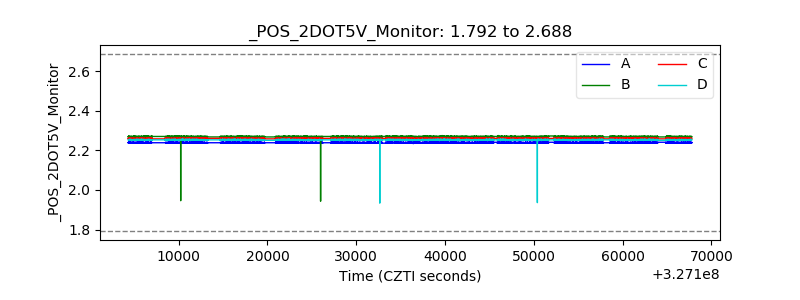 |
| +5 Volts monitor |  |
| _ROLL_ROT |  |
| _Roll_DEC |  |
| _Roll_RA | 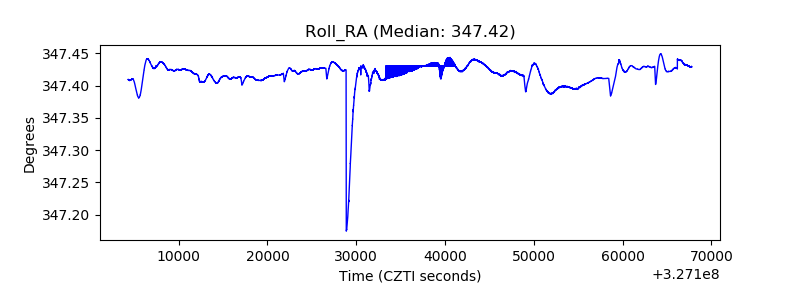 |
| Veto Counter |  |