| Param | Original file | Final file |
|---|---|---|
| Filename | modeM0/AS1A07_027T12_9000003664cztM0_level2_bc.evt | modeM0/AS1A07_027T12_9000003664cztM0_level2_quad_clean.evt |
| Size (bytes) | 374,261,760 | 147,876,480 |
| Size | 356.9 MB | 141.0 MB |
| Events in quadrant A | 2,575,886 | 939,613 |
| Events in quadrant B | 2,628,900 | 964,135 |
| Events in quadrant C | 2,583,238 | 908,042 |
| Events in quadrant D | 2,767,725 | 883,687 |
| Mode SS | |||
|---|---|---|---|
| Quadrant | BADHDUFLAG | Total packets | Discarded packets |
| A | 0 | 232 | 0 |
| B | 0 | 232 | 0 |
| C | 0 | 232 | 0 |
| D | 0 | 232 | 0 |
| Mode M0 | |||
|---|---|---|---|
| Quadrant | BADHDUFLAG | Total packets | Discarded packets |
| A | 0 | 24292 | 0 |
| B | 0 | 24516 | 0 |
| C | 0 | 24684 | 0 |
| D | 0 | 24504 | 0 |
| Mode M9 | |||
|---|---|---|---|
| Quadrant | BADHDUFLAG | Total packets | Discarded packets |
| A | 0 | 36 | 0 |
| B | 0 | 36 | 0 |
| C | 0 | 36 | 0 |
| D | 0 | 36 | 0 |
| Quadrant | Total seconds | Saturated seconds | Saturation percentage |
|---|---|---|---|
| A | 11320 | 110 | 0.971731% |
| B | 11320 | 130 | 1.148410% |
| C | 11320 | 201 | 1.775618% |
| D | 11320 | 105 | 0.927562% |
Noise dominated data is calculated using 1-second bins in cleaned event files. If a bin has >2000 counts, and if more than 50% of those come from <1% of pixels, then it is considered to be noise-dominated and hence unusable.
| Quadrant | # 1 sec bins | Bins with >0 counts | Bins with >2000 counts | High rate bins dominated by noise | Noise dominated (total time) | Noise dominated (detector-on time) | Marked lightcurve |
|---|---|---|---|---|---|---|---|
| A | 14950 | 11320 | 0 | 0 | 0.00% | 0.00% | 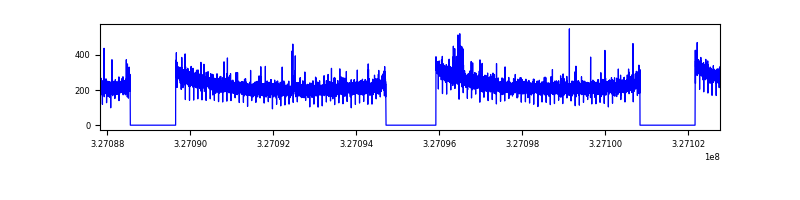 |
| B | 14950 | 11321 | 1 | 1 | 0.01% | 0.01% | 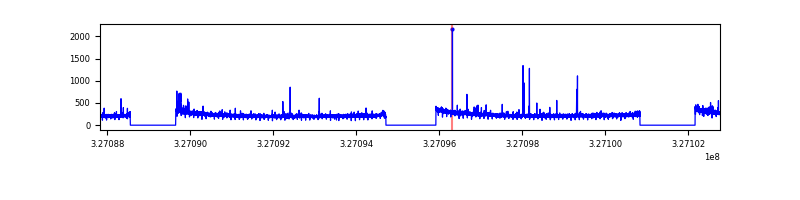 |
| C | 14950 | 11320 | 0 | 0 | 0.00% | 0.00% |  |
| D | 14950 | 11320 | 1 | 1 | 0.01% | 0.01% |  |
Top three noisy pixels from each quadrant. If the there are fewer than three noisy pixels in the level2.evt file, extra rows are filled as -1
| Pixel properties | Quadrant properties | ||||||
|---|---|---|---|---|---|---|---|
| Quadrant | DetID | PixID | Counts | Sigma | Mean | Median | Sigma |
| A | 6 | 16 | 21983 | 148.85 | 663 | 651 | 143.3 |
| A | 13 | 254 | 15019 | 100.26 | 663 | 651 | 143.3 |
| A | 0 | 226 | 4231 | 24.98 | 663 | 651 | 143.3 |
| B | 4 | 173 | 23480 | 181.2 | 674 | 660 | 125.9 |
| B | 0 | 190 | 20212 | 155.25 | 674 | 660 | 125.9 |
| B | 3 | 209 | 5644 | 39.58 | 674 | 660 | 125.9 |
| C | 7 | 247 | 99912 | 656.94 | 640 | 637 | 151.1 |
| C | 2 | 16 | 14340 | 90.68 | 640 | 637 | 151.1 |
| C | 3 | 233 | 4706 | 26.93 | 640 | 637 | 151.1 |
| D | 8 | 195 | 130192 | 865.66 | 648 | 627 | 149.7 |
| D | 10 | 70 | 62139 | 410.98 | 648 | 627 | 149.7 |
| D | 2 | 234 | 47351 | 312.18 | 648 | 627 | 149.7 |
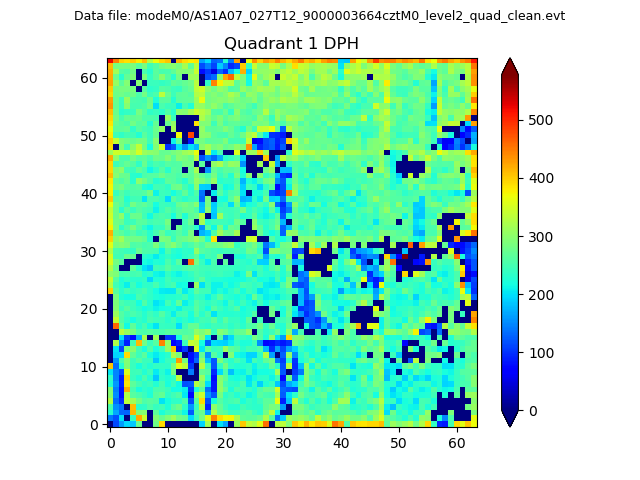
Histogram calculated using DETX and DETY for each event in the final _common_clean file
| Quadrant A |  |
 |
Quadrant B |
|---|---|---|---|
| Quadrant D | 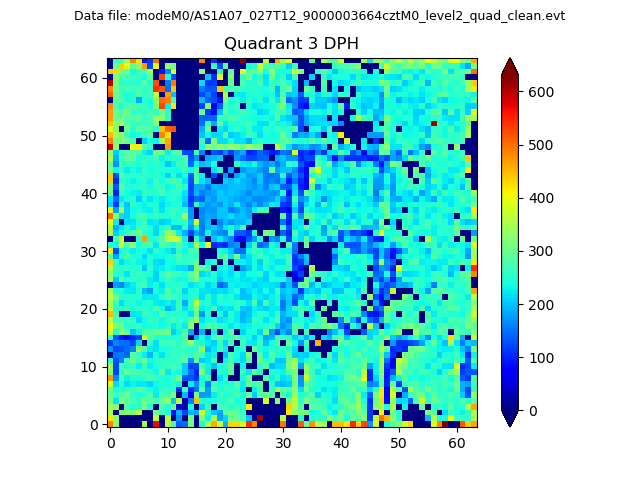 |
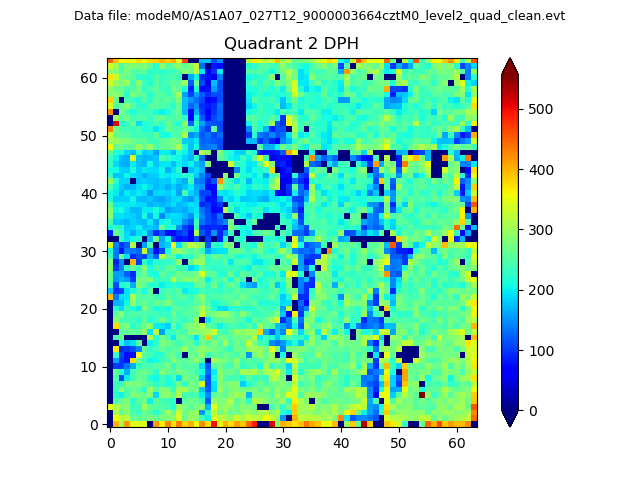 |
Quadrant C |
| Plot type | Count rate plots | Images |
|---|---|---|
| Comparison with Poisson distribution Blue bars denote a histogram of data divided into 1 sec bins. Red curve is a Poisson curve with rate = median count rate of data. |
 |
 |
| Quadrant-wise count rates Data is divided into 100 sec bins |
 |
|
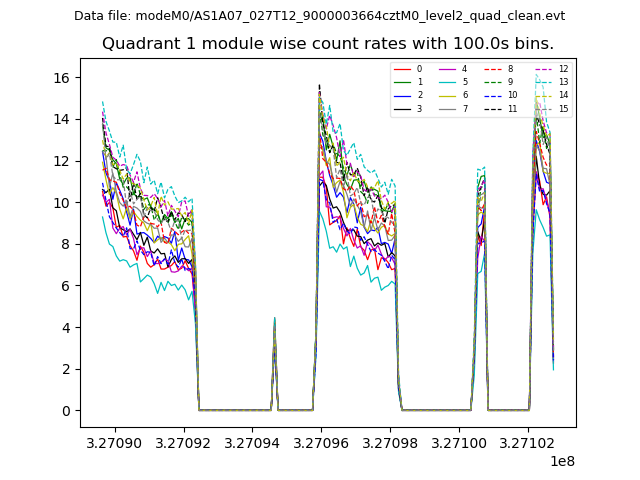
| Module-wise count rates for Quadrant A Data is divided into 100 sec bins |
 |
 |
| Module-wise count rates for Quadrant B Data is divided into 100 sec bins |
 |
 |
| Module-wise count rates for Quadrant C Data is divided into 100 sec bins |
 |
 |
| Module-wise count rates for Quadrant D Data is divided into 100 sec bins |
 |
 |
| Parameter | Plot |
|---|---|
| CZT HV Monitor | 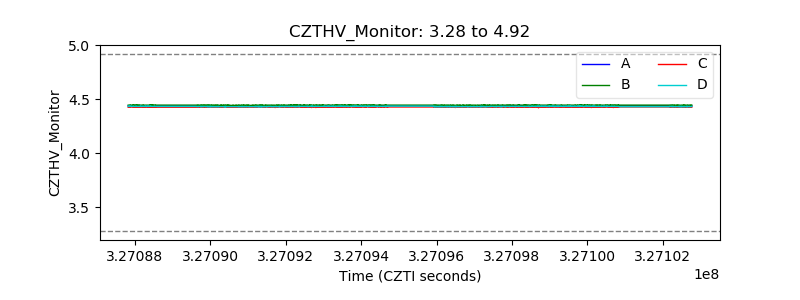 |
| D_VDD |  |
| Temperature 1 |  |
| Veto HV Monitor |  |
| Veto LLD |  |
| Alpha Counter |  |
| _CPM_Rate | 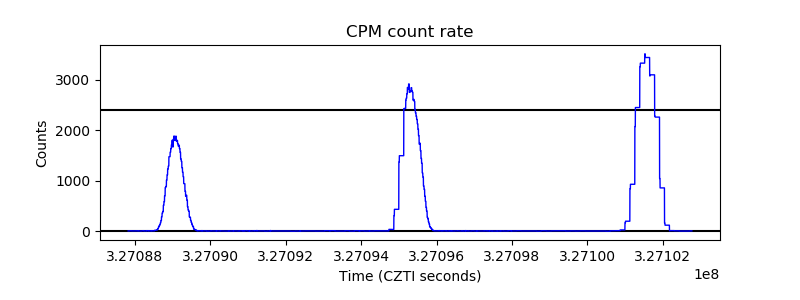 |
| CZT Counter |  |
| +2.5 Volts monitor |  |
| +5 Volts monitor |  |
| _ROLL_ROT |  |
| _Roll_DEC |  |
| _Roll_RA |  |
| Veto Counter |  |