| Param | Original file | Final file |
|---|---|---|
| Filename | modeM0/AS1C05_013T04_9000003660cztM0_level2_bc.evt | modeM0/AS1C05_013T04_9000003660cztM0_level2_quad_clean.evt |
| Size (bytes) | 259,827,840 | 140,532,480 |
| Size | 247.8 MB | 134.0 MB |
| Events in quadrant A | 1,490,315 | 952,352 |
| Events in quadrant B | 1,534,169 | 971,732 |
| Events in quadrant C | 1,794,860 | 921,066 |
| Events in quadrant D | 2,533,722 | 892,753 |
| Mode SS | |||
|---|---|---|---|
| Quadrant | BADHDUFLAG | Total packets | Discarded packets |
| A | 0 | 152 | 0 |
| B | 0 | 152 | 0 |
| C | 0 | 152 | 0 |
| D | 0 | 152 | 0 |
| Mode M0 | |||
|---|---|---|---|
| Quadrant | BADHDUFLAG | Total packets | Discarded packets |
| A | 0 | 15599 | 0 |
| B | 0 | 15711 | 0 |
| C | 0 | 16359 | 0 |
| D | 0 | 18381 | 0 |
| Mode M9 | |||
|---|---|---|---|
| Quadrant | BADHDUFLAG | Total packets | Discarded packets |
| A | 0 | 3 | 0 |
| B | 0 | 3 | 0 |
| C | 0 | 3 | 0 |
| D | 0 | 3 | 0 |
| Quadrant | Total seconds | Saturated seconds | Saturation percentage |
|---|---|---|---|
| A | 7446 | 298 | 4.002149% |
| B | 7446 | 283 | 3.800698% |
| C | 7446 | 242 | 3.250067% |
| D | 7446 | 320 | 4.297609% |
Noise dominated data is calculated using 1-second bins in cleaned event files. If a bin has >2000 counts, and if more than 50% of those come from <1% of pixels, then it is considered to be noise-dominated and hence unusable.
| Quadrant | # 1 sec bins | Bins with >0 counts | Bins with >2000 counts | High rate bins dominated by noise | Noise dominated (total time) | Noise dominated (detector-on time) | Marked lightcurve |
|---|---|---|---|---|---|---|---|
| A | 7801 | 7447 | 0 | 0 | 0.00% | 0.00% |  |
| B | 7801 | 7446 | 0 | 0 | 0.00% | 0.00% |  |
| C | 7801 | 7446 | 0 | 0 | 0.00% | 0.00% | 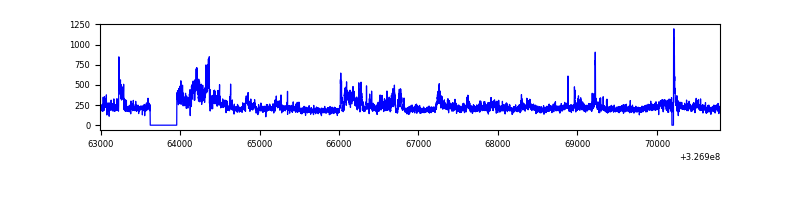 |
| D | 7801 | 7446 | 6 | 6 | 0.08% | 0.08% |  |
Top three noisy pixels from each quadrant. If the there are fewer than three noisy pixels in the level2.evt file, extra rows are filled as -1
| Pixel properties | Quadrant properties | ||||||
|---|---|---|---|---|---|---|---|
| Quadrant | DetID | PixID | Counts | Sigma | Mean | Median | Sigma |
| A | 6 | 16 | 14669 | 163.38 | 381 | 373 | 87.5 |
| A | 13 | 254 | 11510 | 127.28 | 381 | 373 | 87.5 |
| A | 12 | 194 | 2437 | 23.59 | 381 | 373 | 87.5 |
| B | 0 | 190 | 14971 | 193.18 | 387 | 377 | 75.5 |
| B | 0 | 230 | 8084 | 102.02 | 387 | 377 | 75.5 |
| B | 0 | 245 | 5230 | 64.24 | 387 | 377 | 75.5 |
| C | 7 | 247 | 356914 | 4030.69 | 367 | 364 | 88.5 |
| C | 3 | 233 | 19530 | 216.67 | 367 | 364 | 88.5 |
| C | 2 | 16 | 3486 | 35.29 | 367 | 364 | 88.5 |
| D | 7 | 238 | 569538 | 6235.34 | 371 | 356 | 91.3 |
| D | 1 | 52 | 290614 | 3179.75 | 371 | 356 | 91.3 |
| D | 8 | 195 | 132049 | 1442.69 | 371 | 356 | 91.3 |
Histogram calculated using DETX and DETY for each event in the final _common_clean file
| Quadrant A | 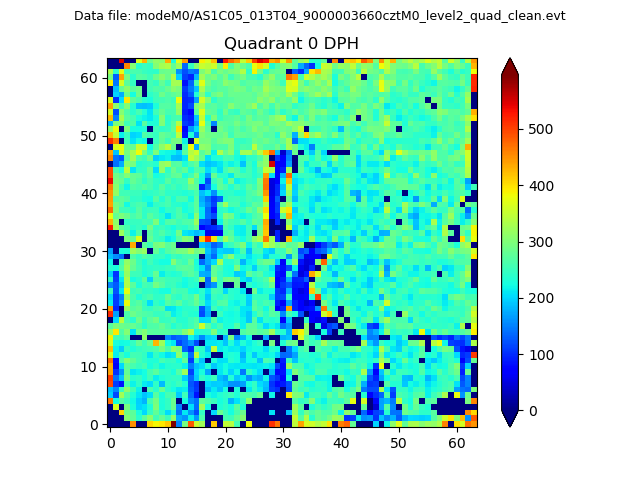 |
 |
Quadrant B |
|---|---|---|---|
| Quadrant D |  |
 |
Quadrant C |
| Plot type | Count rate plots | Images |
|---|---|---|
| Comparison with Poisson distribution Blue bars denote a histogram of data divided into 1 sec bins. Red curve is a Poisson curve with rate = median count rate of data. |
 |
 |
| Quadrant-wise count rates Data is divided into 100 sec bins |
 |
|
| Module-wise count rates for Quadrant A Data is divided into 100 sec bins |
 |
 |
| Module-wise count rates for Quadrant B Data is divided into 100 sec bins |
 |
 |
| Module-wise count rates for Quadrant C Data is divided into 100 sec bins |
 |
 |
| Module-wise count rates for Quadrant D Data is divided into 100 sec bins |
 |
 |
| Parameter | Plot |
|---|---|
| CZT HV Monitor | 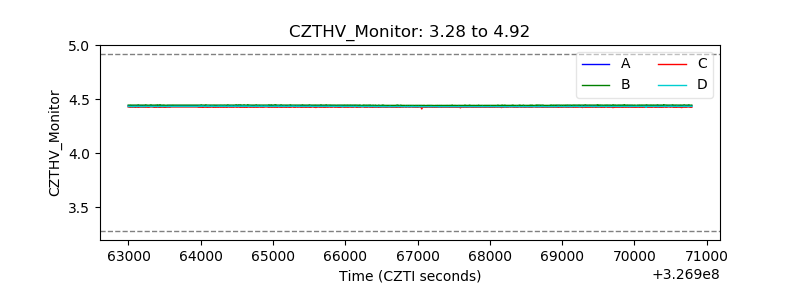 |
| D_VDD | 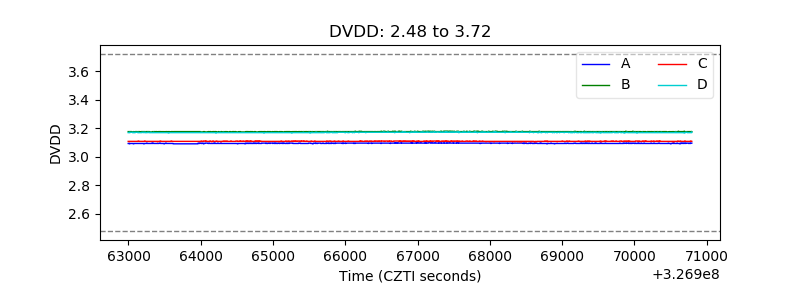 |
| Temperature 1 |  |
| Veto HV Monitor |  |
| Veto LLD |  |
| Alpha Counter |  |
| _CPM_Rate |  |
| CZT Counter |  |
| +2.5 Volts monitor |  |
| +5 Volts monitor |  |
| _ROLL_ROT |  |
| _Roll_DEC |  |
| _Roll_RA | 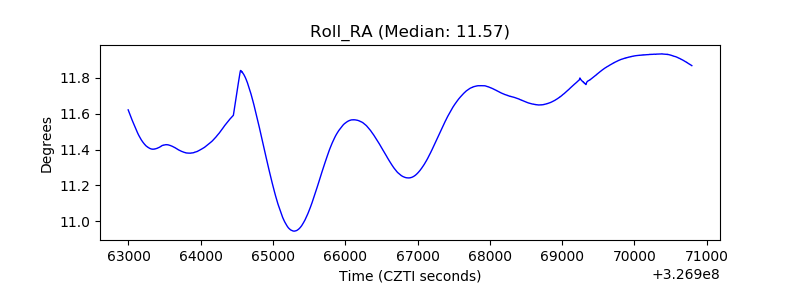 |
| Veto Counter |  |