| Param | Original file | Final file |
|---|---|---|
| Filename | modeM0/AS1A07_127T03_9000003662cztM0_level2.evt | modeM0/AS1A07_127T03_9000003662cztM0_level2_quad_clean.evt |
| Size (bytes) | 7,750,967,040 | 1,320,217,920 |
| Size | 7.2 GB | 1.2 GB |
| Events in quadrant A | 49,095,251 | 8,410,200 |
| Events in quadrant B | 51,088,133 | 8,573,619 |
| Events in quadrant C | 58,921,682 | 8,162,809 |
| Events in quadrant D | 68,867,914 | 7,955,999 |
| Mode M0 | |||
|---|---|---|---|
| Quadrant | BADHDUFLAG | Total packets | Discarded packets |
| A | 0 | 209777 | 0 |
| B | 0 | 214664 | 0 |
| C | 0 | 237829 | 0 |
| D | 0 | 271437 | 0 |
| Mode SS | |||
|---|---|---|---|
| Quadrant | BADHDUFLAG | Total packets | Discarded packets |
| A | 0 | 2046 | 0 |
| B | 0 | 2046 | 0 |
| C | 0 | 2046 | 0 |
| D | 0 | 2046 | 0 |
| Mode M9 | |||
|---|---|---|---|
| Quadrant | BADHDUFLAG | Total packets | Discarded packets |
| A | 0 | 139 | 0 |
| B | 0 | 139 | 0 |
| C | 0 | 139 | 0 |
| D | 0 | 139 | 0 |
| Quadrant | Total seconds | Saturated seconds | Saturation percentage |
|---|---|---|---|
| A | 100450 | 1622 | 1.614734% |
| B | 100450 | 2013 | 2.003982% |
| C | 100450 | 3538 | 3.522150% |
| D | 100450 | 3998 | 3.980090% |
Noise dominated data is calculated using 1-second bins in cleaned event files. If a bin has >2000 counts, and if more than 50% of those come from <1% of pixels, then it is considered to be noise-dominated and hence unusable.
| Quadrant | # 1 sec bins | Bins with >0 counts | Bins with >2000 counts | High rate bins dominated by noise | Noise dominated (total time) | Noise dominated (detector-on time) | Marked lightcurve |
|---|---|---|---|---|---|---|---|
| A | 114451 | 100467 | 3 | 3 | 0.00% | 0.00% | 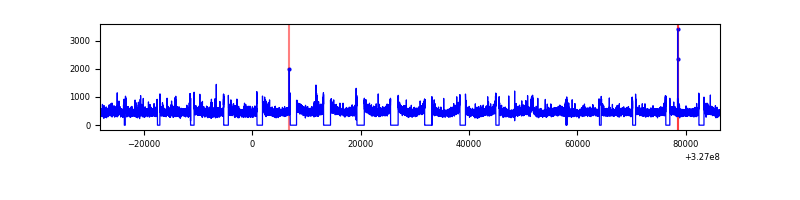 |
| B | 114451 | 100468 | 80 | 80 | 0.07% | 0.08% |  |
| C | 114451 | 100468 | 557 | 557 | 0.49% | 0.55% |  |
| D | 114451 | 100468 | 2463 | 2463 | 2.15% | 2.45% |  |
Top three noisy pixels from each quadrant. If the there are fewer than three noisy pixels in the level2.evt file, extra rows are filled as -1
| Pixel properties | Quadrant properties | ||||||
|---|---|---|---|---|---|---|---|
| Quadrant | DetID | PixID | Counts | Sigma | Mean | Median | Sigma |
| A | 13 | 254 | 154791 | 56.34 | 12699 | 12432 | 2526.9 |
| A | 3 | 137 | 115487 | 40.78 | 12699 | 12432 | 2526.9 |
| A | 0 | 226 | 108448 | 38.0 | 12699 | 12432 | 2526.9 |
| B | 3 | 64 | 383435 | 156.64 | 12634 | 12314 | 2369.2 |
| B | 0 | 190 | 375754 | 153.4 | 12634 | 12314 | 2369.2 |
| B | 12 | 111 | 294811 | 119.24 | 12634 | 12314 | 2369.2 |
| C | 7 | 247 | 9014116 | 3165.17 | 12191 | 12275 | 2844.0 |
| C | 14 | 238 | 1927345 | 673.36 | 12191 | 12275 | 2844.0 |
| C | 2 | 16 | 193440 | 63.7 | 12191 | 12275 | 2844.0 |
| D | 7 | 238 | 9085005 | 3046.18 | 12337 | 12006 | 2978.5 |
| D | 1 | 52 | 7833129 | 2625.87 | 12337 | 12006 | 2978.5 |
| D | 8 | 195 | 3538882 | 1184.12 | 12337 | 12006 | 2978.5 |
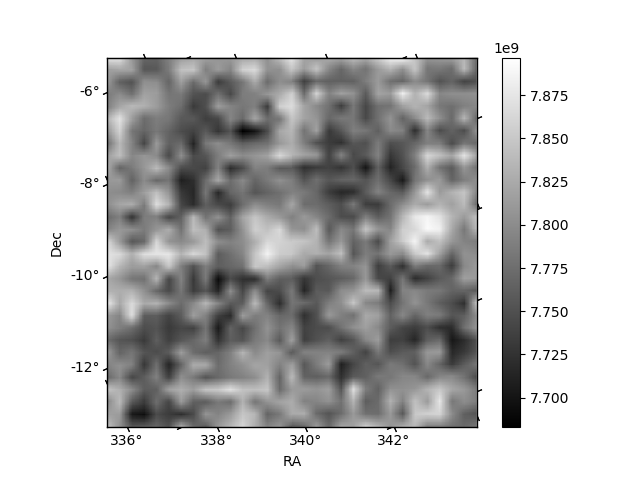
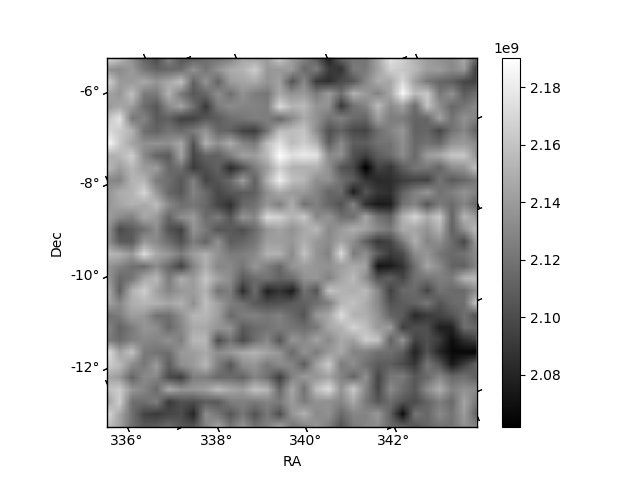
Histogram calculated using DETX and DETY for each event in the final _common_clean file
| Quadrant A |  |
 |
Quadrant B |
|---|---|---|---|
| Quadrant D |  |
 |
Quadrant C |
| Plot type | Count rate plots | Images |
|---|---|---|
| Comparison with Poisson distribution Blue bars denote a histogram of data divided into 1 sec bins. Red curve is a Poisson curve with rate = median count rate of data. |
 |
 |
| Quadrant-wise count rates Data is divided into 100 sec bins |
 |
|
| Module-wise count rates for Quadrant A Data is divided into 100 sec bins |
 |
 |
| Module-wise count rates for Quadrant B Data is divided into 100 sec bins |
 |
 |
| Module-wise count rates for Quadrant C Data is divided into 100 sec bins |
 |
 |
| Module-wise count rates for Quadrant D Data is divided into 100 sec bins |
 |
 |
| Parameter | Plot |
|---|---|
| CZT HV Monitor |  |
| D_VDD |  |
| Temperature 1 | 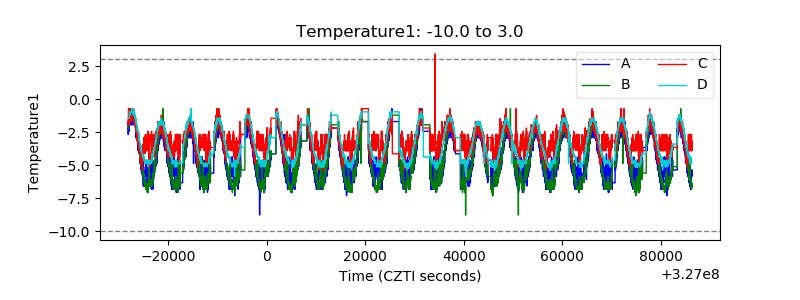 |
| Veto HV Monitor |  |
| Veto LLD |  |
| Alpha Counter |  |
| _CPM_Rate |  |
| CZT Counter | 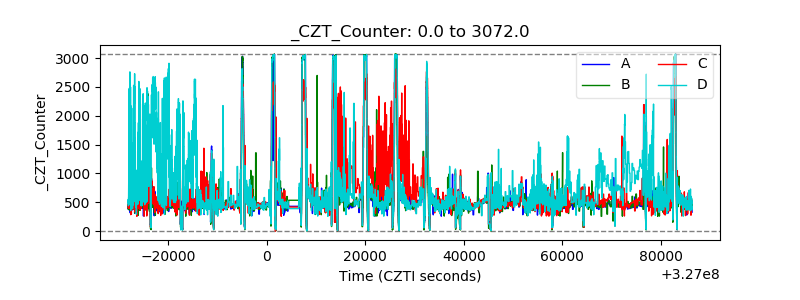 |
| +2.5 Volts monitor |  |
| +5 Volts monitor | 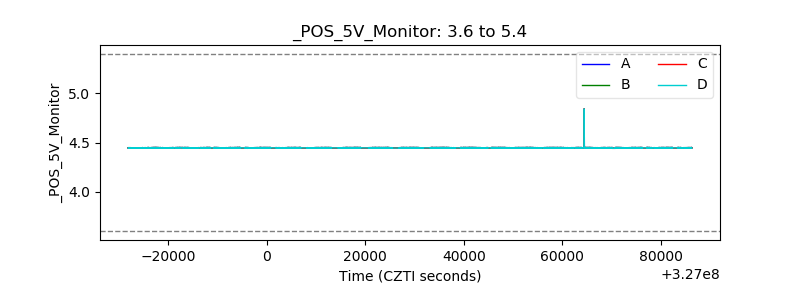 |
| _ROLL_ROT |  |
| _Roll_DEC |  |
| _Roll_RA | 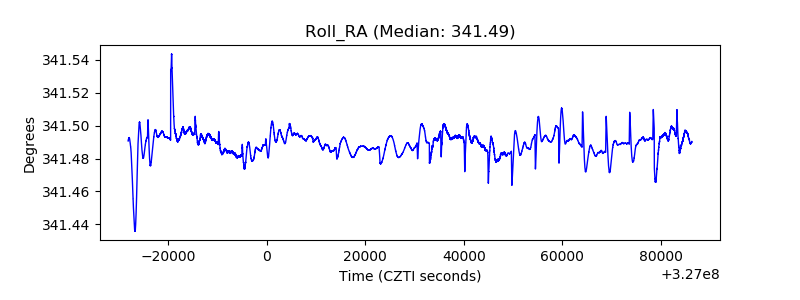 |
| Veto Counter |  |