| Param | Original file | Final file |
|---|---|---|
| Filename | modeM0/AS1A08_003T18_9000003658cztM0_level2_bc.evt | modeM0/AS1A08_003T18_9000003658cztM0_level2_quad_clean.evt |
| Size (bytes) | 1,635,062,400 | 519,497,280 |
| Size | 1.5 GB | 495.4 MB |
| Events in quadrant A | 9,112,532 | 3,313,105 |
| Events in quadrant B | 9,561,445 | 3,390,041 |
| Events in quadrant C | 11,741,461 | 3,138,381 |
| Events in quadrant D | 16,266,336 | 3,036,496 |
| Mode M9 | |||
|---|---|---|---|
| Quadrant | BADHDUFLAG | Total packets | Discarded packets |
| A | 0 | 96 | 0 |
| B | 0 | 96 | 0 |
| C | 0 | 96 | 0 |
| D | 0 | 96 | 0 |
| Mode SS | |||
|---|---|---|---|
| Quadrant | BADHDUFLAG | Total packets | Discarded packets |
| A | 0 | 433 | 0 |
| B | 0 | 433 | 0 |
| C | 0 | 433 | 0 |
| D | 0 | 433 | 0 |
| Mode M0 | |||
|---|---|---|---|
| Quadrant | BADHDUFLAG | Total packets | Discarded packets |
| A | 0 | 88652 | 0 |
| B | 0 | 90158 | 0 |
| C | 0 | 98560 | 0 |
| D | 0 | 114226 | 0 |
| Quadrant | Total seconds | Saturated seconds | Saturation percentage |
|---|---|---|---|
| A | 42465 | 286 | 0.673496% |
| B | 42465 | 381 | 0.897209% |
| C | 42464 | 1064 | 2.505652% |
| D | 42465 | 1031 | 2.427882% |
Noise dominated data is calculated using 1-second bins in cleaned event files. If a bin has >2000 counts, and if more than 50% of those come from <1% of pixels, then it is considered to be noise-dominated and hence unusable.
| Quadrant | # 1 sec bins | Bins with >0 counts | Bins with >2000 counts | High rate bins dominated by noise | Noise dominated (total time) | Noise dominated (detector-on time) | Marked lightcurve |
|---|---|---|---|---|---|---|---|
| A | 52015 | 41607 | 1 | 1 | 0.00% | 0.00% |  |
| B | 52015 | 41607 | 6 | 6 | 0.01% | 0.01% |  |
| C | 52015 | 41606 | 147 | 147 | 0.28% | 0.35% |  |
| D | 52015 | 41604 | 120 | 120 | 0.23% | 0.29% |  |
Top three noisy pixels from each quadrant. If the there are fewer than three noisy pixels in the level2.evt file, extra rows are filled as -1
| Pixel properties | Quadrant properties | ||||||
|---|---|---|---|---|---|---|---|
| Quadrant | DetID | PixID | Counts | Sigma | Mean | Median | Sigma |
| A | 13 | 254 | 53778 | 102.2 | 2345 | 2304 | 503.7 |
| A | 9 | 130 | 47289 | 89.31 | 2345 | 2304 | 503.7 |
| A | 6 | 16 | 26765 | 48.57 | 2345 | 2304 | 503.7 |
| B | 3 | 64 | 155630 | 345.28 | 2387 | 2334 | 444.0 |
| B | 10 | 246 | 102973 | 226.67 | 2387 | 2334 | 444.0 |
| B | 0 | 190 | 57352 | 123.92 | 2387 | 2334 | 444.0 |
| C | 7 | 247 | 2401392 | 4607.28 | 2238 | 2233 | 520.7 |
| C | 2 | 16 | 546007 | 1044.25 | 2238 | 2233 | 520.7 |
| C | 0 | 10 | 175716 | 333.15 | 2238 | 2233 | 520.7 |
| D | 7 | 238 | 3839100 | 7368.99 | 2255 | 2178 | 520.7 |
| D | 10 | 70 | 1370643 | 2628.2 | 2255 | 2178 | 520.7 |
| D | 1 | 52 | 1114537 | 2136.34 | 2255 | 2178 | 520.7 |
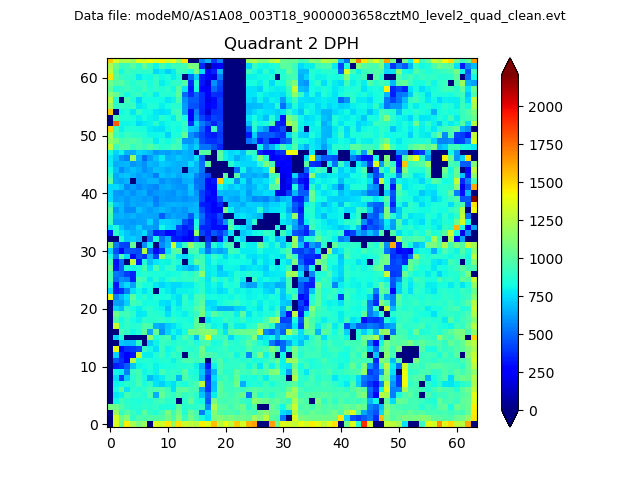
Histogram calculated using DETX and DETY for each event in the final _common_clean file
| Quadrant A |  |
 |
Quadrant B |
|---|---|---|---|
| Quadrant D |  |
 |
Quadrant C |
| Plot type | Count rate plots | Images |
|---|---|---|
| Comparison with Poisson distribution Blue bars denote a histogram of data divided into 1 sec bins. Red curve is a Poisson curve with rate = median count rate of data. |
 |
 |
| Quadrant-wise count rates Data is divided into 100 sec bins |
 |
|
| Module-wise count rates for Quadrant A Data is divided into 100 sec bins |
 |
 |
| Module-wise count rates for Quadrant B Data is divided into 100 sec bins |
 |
 |
| Module-wise count rates for Quadrant C Data is divided into 100 sec bins |
 |
 |
| Module-wise count rates for Quadrant D Data is divided into 100 sec bins |
 |
 |
| Parameter | Plot |
|---|---|
| CZT HV Monitor |  |
| D_VDD |  |
| Temperature 1 |  |
| Veto HV Monitor |  |
| Veto LLD |  |
| Alpha Counter |  |
| _CPM_Rate |  |
| CZT Counter |  |
| +2.5 Volts monitor |  |
| +5 Volts monitor |  |
| _ROLL_ROT |  |
| _Roll_DEC | 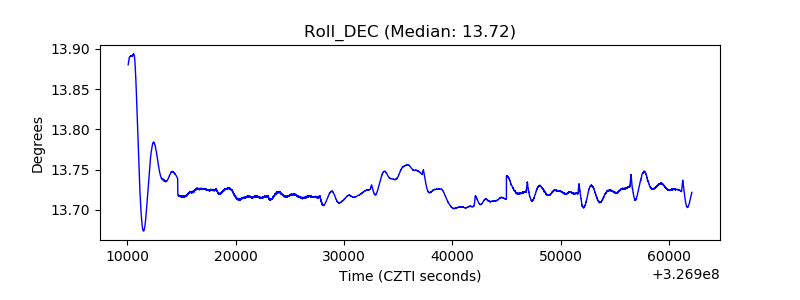 |
| _Roll_RA |  |
| Veto Counter |  |