| Param | Original file | Final file |
|---|---|---|
| Filename | modeM0/AS1A08_003T17_9000003656cztM0_level2_bc.evt | modeM0/AS1A08_003T17_9000003656cztM0_level2_quad_clean.evt |
| Size (bytes) | 956,764,800 | 327,925,440 |
| Size | 912.4 MB | 312.7 MB |
| Events in quadrant A | 5,279,991 | 2,078,796 |
| Events in quadrant B | 6,680,018 | 2,081,844 |
| Events in quadrant C | 5,844,136 | 1,994,288 |
| Events in quadrant D | 9,346,135 | 1,941,605 |
| Mode M0 | |||
|---|---|---|---|
| Quadrant | BADHDUFLAG | Total packets | Discarded packets |
| A | 0 | 54994 | 0 |
| B | 0 | 60491 | 0 |
| C | 0 | 57064 | 0 |
| D | 0 | 67467 | 0 |
| Mode SS | |||
|---|---|---|---|
| Quadrant | BADHDUFLAG | Total packets | Discarded packets |
| A | 0 | 546 | 0 |
| B | 0 | 546 | 0 |
| C | 0 | 546 | 0 |
| D | 0 | 546 | 0 |
| Mode M9 | |||
|---|---|---|---|
| Quadrant | BADHDUFLAG | Total packets | Discarded packets |
| A | 0 | 19 | 0 |
| B | 0 | 19 | 0 |
| C | 0 | 19 | 0 |
| D | 0 | 19 | 0 |
| Quadrant | Total seconds | Saturated seconds | Saturation percentage |
|---|---|---|---|
| A | 26686 | 592 | 2.218392% |
| B | 26687 | 1189 | 4.455353% |
| C | 26687 | 732 | 2.742909% |
| D | 26686 | 989 | 3.706063% |
Noise dominated data is calculated using 1-second bins in cleaned event files. If a bin has >2000 counts, and if more than 50% of those come from <1% of pixels, then it is considered to be noise-dominated and hence unusable.
| Quadrant | # 1 sec bins | Bins with >0 counts | Bins with >2000 counts | High rate bins dominated by noise | Noise dominated (total time) | Noise dominated (detector-on time) | Marked lightcurve |
|---|---|---|---|---|---|---|---|
| A | 29147 | 26687 | 4 | 4 | 0.01% | 0.01% | 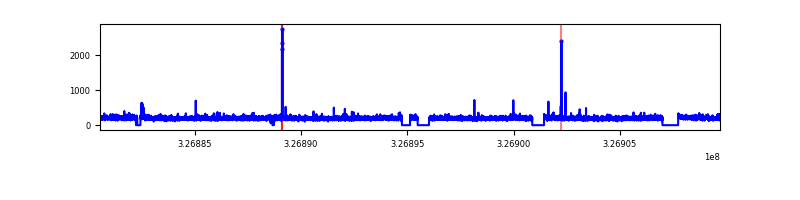 |
| B | 29147 | 26686 | 82 | 82 | 0.28% | 0.31% | 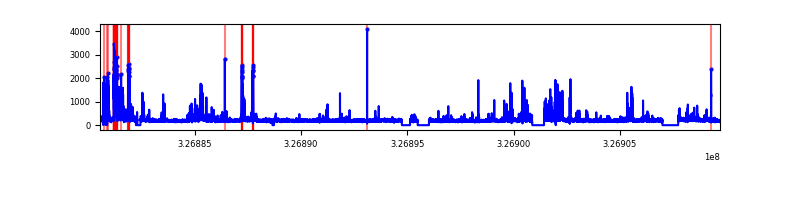 |
| C | 29147 | 26688 | 13 | 13 | 0.04% | 0.05% | 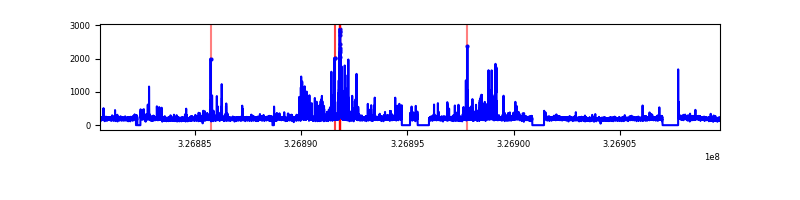 |
| D | 29147 | 26687 | 137 | 137 | 0.47% | 0.51% |  |
Top three noisy pixels from each quadrant. If the there are fewer than three noisy pixels in the level2.evt file, extra rows are filled as -1
| Pixel properties | Quadrant properties | ||||||
|---|---|---|---|---|---|---|---|
| Quadrant | DetID | PixID | Counts | Sigma | Mean | Median | Sigma |
| A | 13 | 254 | 38008 | 121.27 | 1357 | 1325 | 302.5 |
| A | 6 | 16 | 34535 | 109.79 | 1357 | 1325 | 302.5 |
| A | 0 | 226 | 8521 | 23.79 | 1357 | 1325 | 302.5 |
| B | 3 | 64 | 747773 | 2868.86 | 1357 | 1322 | 260.2 |
| B | 10 | 246 | 570091 | 2185.97 | 1357 | 1322 | 260.2 |
| B | 0 | 190 | 43183 | 160.89 | 1357 | 1322 | 260.2 |
| C | 7 | 247 | 733047 | 2340.71 | 1308 | 1293 | 312.6 |
| C | 8 | 128 | 28044 | 85.57 | 1308 | 1293 | 312.6 |
| C | 3 | 233 | 20838 | 62.52 | 1308 | 1293 | 312.6 |
| D | 8 | 195 | 1625777 | 5194.22 | 1323 | 1273 | 312.8 |
| D | 7 | 238 | 1226653 | 3918.05 | 1323 | 1273 | 312.8 |
| D | 1 | 52 | 931428 | 2974.09 | 1323 | 1273 | 312.8 |
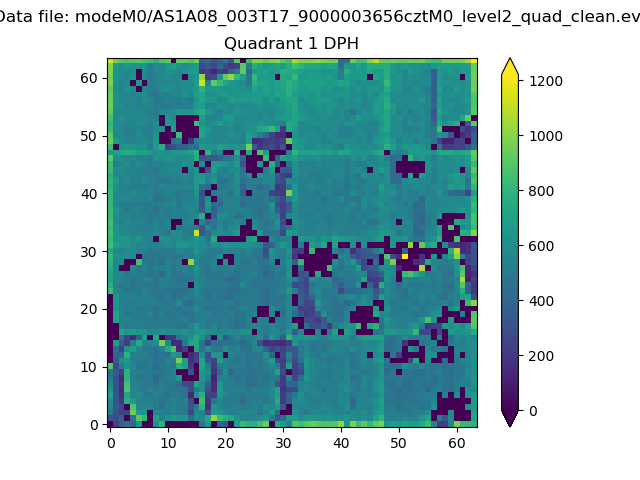
Histogram calculated using DETX and DETY for each event in the final _common_clean file
| Quadrant A | 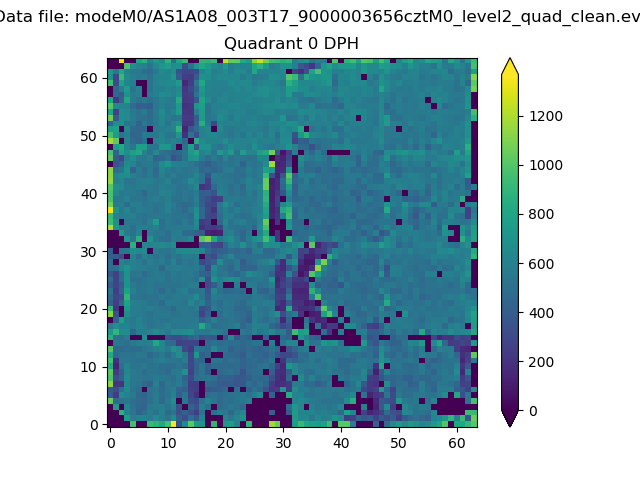 |
 |
Quadrant B |
|---|---|---|---|
| Quadrant D | 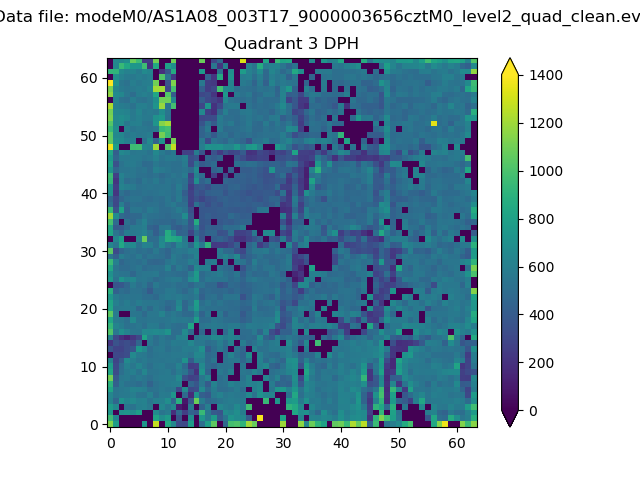 |
 |
Quadrant C |
| Plot type | Count rate plots | Images |
|---|---|---|
| Comparison with Poisson distribution Blue bars denote a histogram of data divided into 1 sec bins. Red curve is a Poisson curve with rate = median count rate of data. |
 |
 |
| Quadrant-wise count rates Data is divided into 100 sec bins |
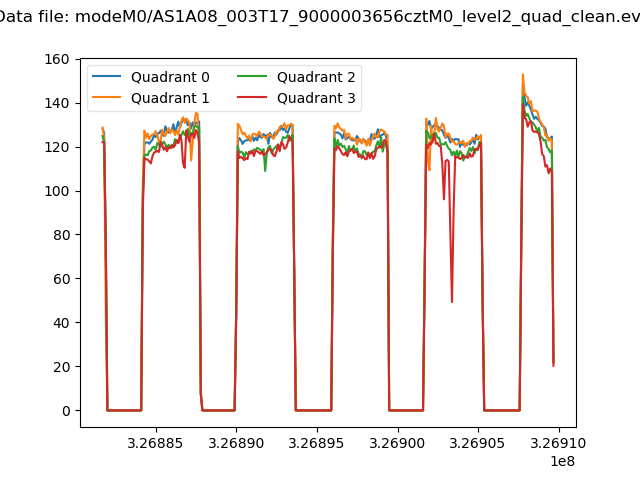 |
|
| Module-wise count rates for Quadrant A Data is divided into 100 sec bins |
 |
 |
| Module-wise count rates for Quadrant B Data is divided into 100 sec bins |
 |
 |
| Module-wise count rates for Quadrant C Data is divided into 100 sec bins |
 |
 |
| Module-wise count rates for Quadrant D Data is divided into 100 sec bins |
 |
 |
| Parameter | Plot |
|---|---|
| CZT HV Monitor |  |
| D_VDD |  |
| Temperature 1 |  |
| Veto HV Monitor |  |
| Veto LLD |  |
| Alpha Counter |  |
| _CPM_Rate |  |
| CZT Counter |  |
| +2.5 Volts monitor |  |
| +5 Volts monitor |  |
| _ROLL_ROT |  |
| _Roll_DEC |  |
| _Roll_RA | 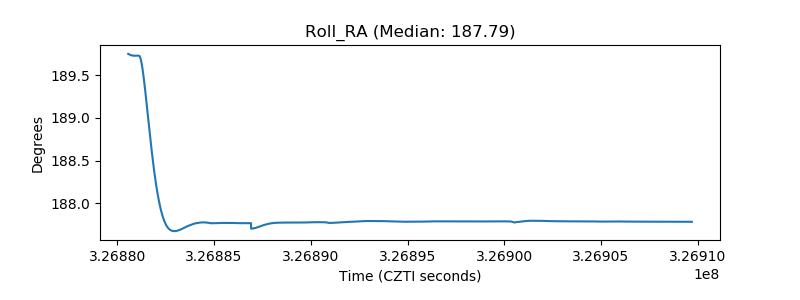 |
| Veto Counter | 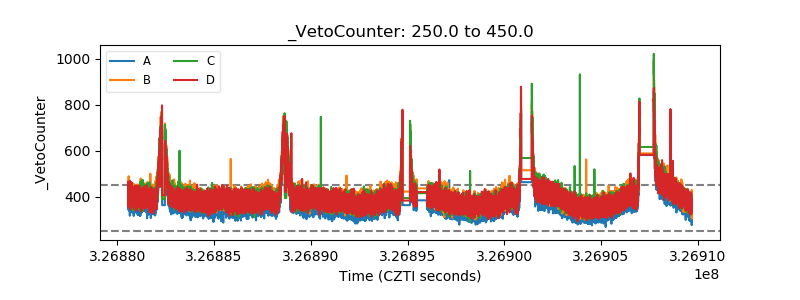 |