| Param | Original file | Final file |
|---|---|---|
| Filename | modeM0/AS1T03_200T01_9000003654cztM0_level2_bc.evt | modeM0/AS1T03_200T01_9000003654cztM0_level2_quad_clean.evt |
| Size (bytes) | 7,386,148,800 | 3,550,988,160 |
| Size | 6.9 GB | 3.3 GB |
| Events in quadrant A | 38,454,742 | 24,327,857 |
| Events in quadrant B | 45,869,990 | 24,698,606 |
| Events in quadrant C | 52,286,685 | 23,470,944 |
| Events in quadrant D | 74,669,107 | 22,572,611 |
| Mode M9 | |||
|---|---|---|---|
| Quadrant | BADHDUFLAG | Total packets | Discarded packets |
| A | 0 | 313 | 0 |
| B | 0 | 313 | 0 |
| C | 0 | 313 | 0 |
| D | 0 | 313 | 0 |
| Mode SS | |||
|---|---|---|---|
| Quadrant | BADHDUFLAG | Total packets | Discarded packets |
| A | 0 | 3716 | 0 |
| B | 0 | 3716 | 0 |
| C | 0 | 3716 | 0 |
| D | 0 | 3716 | 0 |
| Mode M0 | |||
|---|---|---|---|
| Quadrant | BADHDUFLAG | Total packets | Discarded packets |
| A | 0 | 375712 | 0 |
| B | 0 | 402231 | 0 |
| C | 0 | 423925 | 0 |
| D | 0 | 492243 | 0 |
| Quadrant | Total seconds | Saturated seconds | Saturation percentage |
|---|---|---|---|
| A | 182474 | 1843 | 1.010007% |
| B | 182475 | 3556 | 1.948760% |
| C | 182475 | 4299 | 2.355939% |
| D | 182475 | 7312 | 4.007124% |
Noise dominated data is calculated using 1-second bins in cleaned event files. If a bin has >2000 counts, and if more than 50% of those come from <1% of pixels, then it is considered to be noise-dominated and hence unusable.
| Quadrant | # 1 sec bins | Bins with >0 counts | Bins with >2000 counts | High rate bins dominated by noise | Noise dominated (total time) | Noise dominated (detector-on time) | Marked lightcurve |
|---|---|---|---|---|---|---|---|
| A | 213856 | 182480 | 40 | 40 | 0.02% | 0.02% | 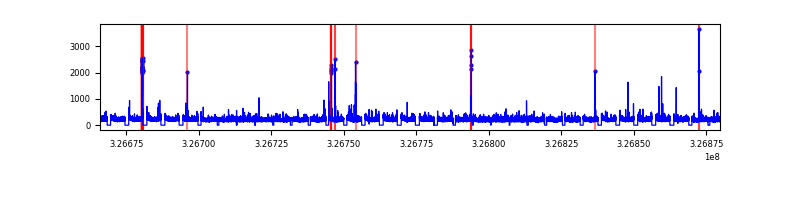 |
| B | 213856 | 182483 | 204 | 204 | 0.10% | 0.11% | 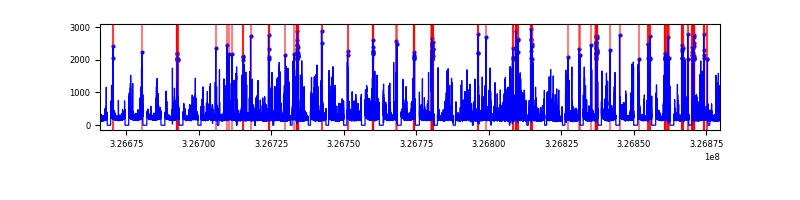 |
| C | 213856 | 182480 | 409 | 409 | 0.19% | 0.22% |  |
| D | 213856 | 182479 | 2046 | 2046 | 0.96% | 1.12% |  |
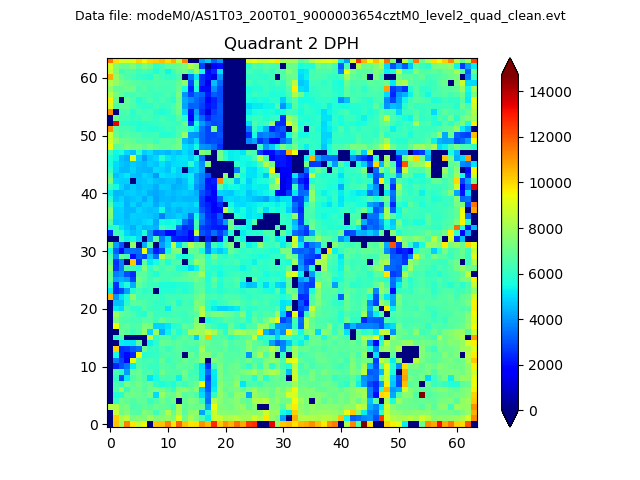
Top three noisy pixels from each quadrant. If the there are fewer than three noisy pixels in the level2.evt file, extra rows are filled as -1
| Pixel properties | Quadrant properties | ||||||
|---|---|---|---|---|---|---|---|
| Quadrant | DetID | PixID | Counts | Sigma | Mean | Median | Sigma |
| A | 4 | 2 | 306950 | 140.88 | 9788 | 9650 | 2110.4 |
| A | 13 | 254 | 271743 | 124.19 | 9788 | 9650 | 2110.4 |
| A | 6 | 16 | 200358 | 90.37 | 9788 | 9650 | 2110.4 |
| B | 3 | 64 | 2040120 | 1096.58 | 9891 | 9670 | 1851.6 |
| B | 5 | 172 | 1397527 | 749.54 | 9891 | 9670 | 1851.6 |
| B | 0 | 229 | 1014270 | 542.55 | 9891 | 9670 | 1851.6 |
| C | 7 | 247 | 15213964 | 6829.08 | 9389 | 9381 | 2226.4 |
| C | 0 | 207 | 308304 | 134.26 | 9389 | 9381 | 2226.4 |
| C | 3 | 233 | 269241 | 116.72 | 9389 | 9381 | 2226.4 |
| D | 1 | 52 | 16581774 | 7515.09 | 9447 | 9138 | 2205.2 |
| D | 1 | 3 | 9771175 | 4426.73 | 9447 | 9138 | 2205.2 |
| D | 8 | 195 | 6553589 | 2967.67 | 9447 | 9138 | 2205.2 |
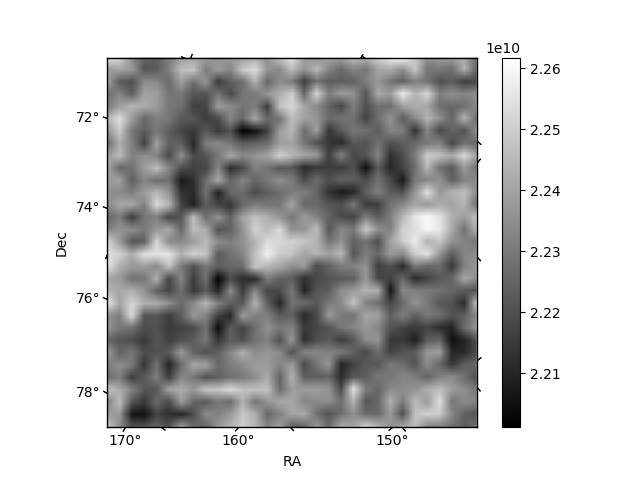
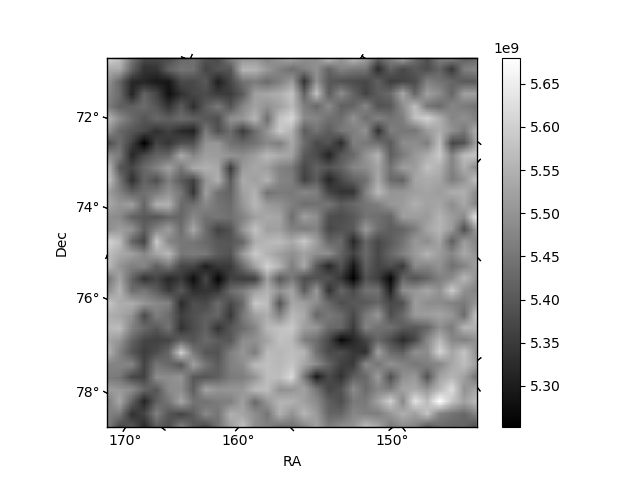
Histogram calculated using DETX and DETY for each event in the final _common_clean file
| Quadrant A |  |
 |
Quadrant B |
|---|---|---|---|
| Quadrant D | 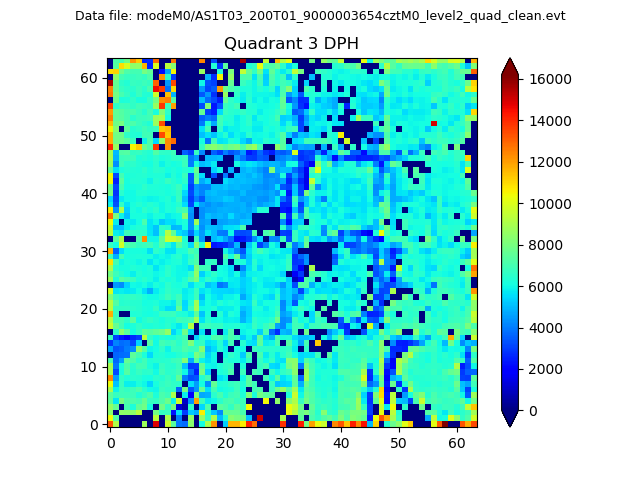 |
 |
Quadrant C |
| Plot type | Count rate plots | Images |
|---|---|---|
| Comparison with Poisson distribution Blue bars denote a histogram of data divided into 1 sec bins. Red curve is a Poisson curve with rate = median count rate of data. |
 |
 |
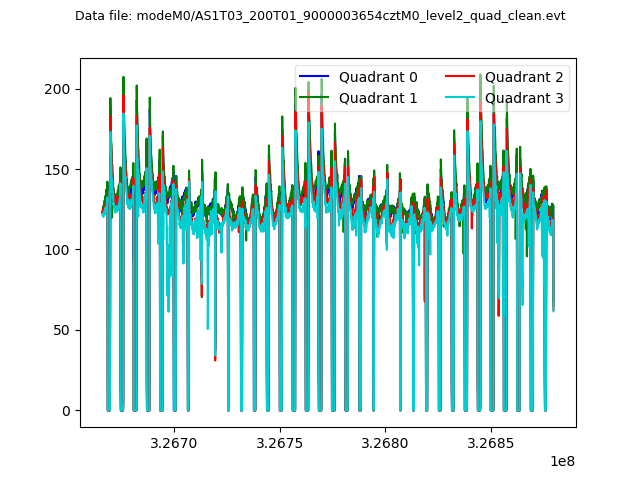
| Quadrant-wise count rates Data is divided into 100 sec bins |
 |
|
| Module-wise count rates for Quadrant A Data is divided into 100 sec bins |
 |
 |
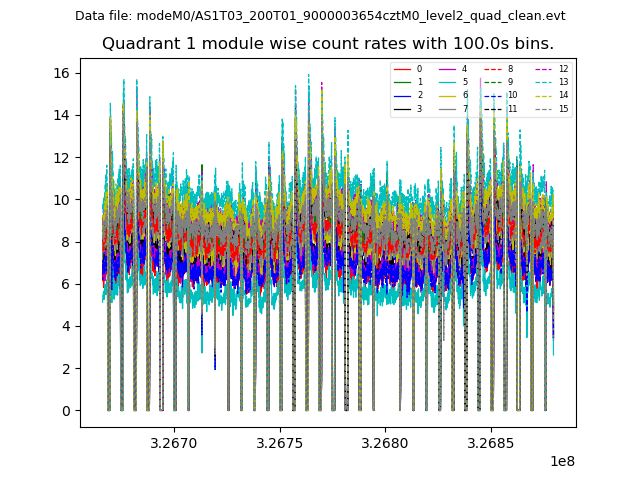
| Module-wise count rates for Quadrant B Data is divided into 100 sec bins |
 |
 |
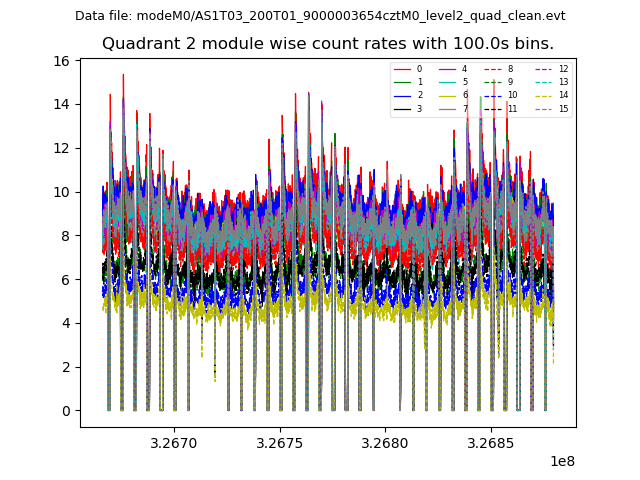
| Module-wise count rates for Quadrant C Data is divided into 100 sec bins |
 |
 |
| Module-wise count rates for Quadrant D Data is divided into 100 sec bins |
 |
 |
| Parameter | Plot |
|---|---|
| CZT HV Monitor |  |
| D_VDD |  |
| Temperature 1 |  |
| Veto HV Monitor |  |
| Veto LLD | 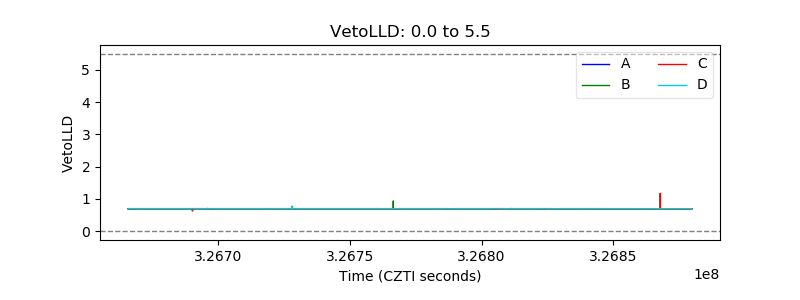 |
| Alpha Counter |  |
| _CPM_Rate |  |
| CZT Counter |  |
| +2.5 Volts monitor |  |
| +5 Volts monitor |  |
| _ROLL_ROT |  |
| _Roll_DEC |  |
| _Roll_RA | 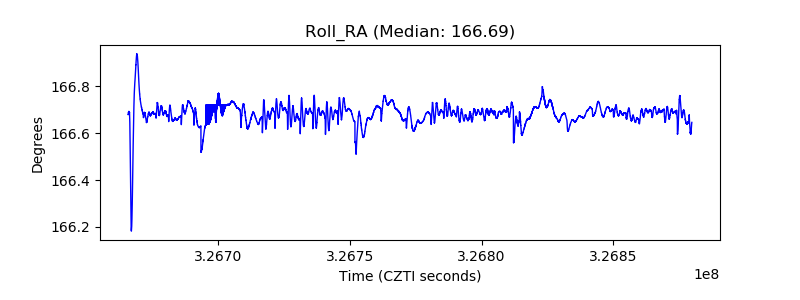 |
| Veto Counter | 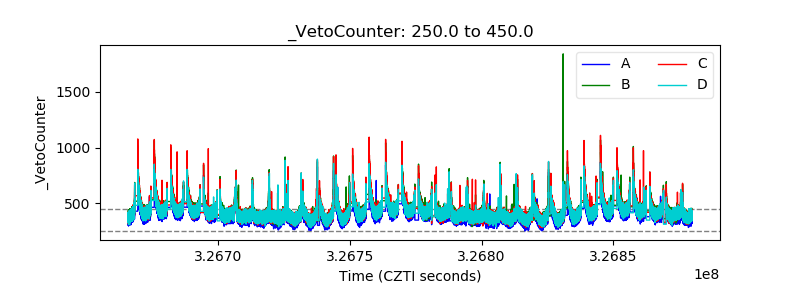 |