| Param | Original file | Final file |
|---|---|---|
| Filename | modeM0/AS1T03_205T01_9000003652cztM0_level2_bc.evt | modeM0/AS1T03_205T01_9000003652cztM0_level2_quad_clean.evt |
| Size (bytes) | 3,545,507,520 | 1,859,618,880 |
| Size | 3.3 GB | 1.7 GB |
| Events in quadrant A | 20,287,845 | 12,722,872 |
| Events in quadrant B | 20,986,199 | 12,902,166 |
| Events in quadrant C | 29,598,036 | 12,225,404 |
| Events in quadrant D | 30,088,724 | 12,025,879 |
| Mode SS | |||
|---|---|---|---|
| Quadrant | BADHDUFLAG | Total packets | Discarded packets |
| A | 0 | 1916 | 0 |
| B | 0 | 1916 | 0 |
| C | 0 | 1916 | 0 |
| D | 0 | 1916 | 0 |
| Mode M9 | |||
|---|---|---|---|
| Quadrant | BADHDUFLAG | Total packets | Discarded packets |
| A | 0 | 149 | 0 |
| B | 0 | 149 | 0 |
| C | 0 | 149 | 0 |
| D | 0 | 149 | 0 |
| Mode M0 | |||
|---|---|---|---|
| Quadrant | BADHDUFLAG | Total packets | Discarded packets |
| A | 0 | 195283 | 0 |
| B | 0 | 197987 | 0 |
| C | 0 | 226396 | 0 |
| D | 0 | 227784 | 0 |
| Quadrant | Total seconds | Saturated seconds | Saturation percentage |
|---|---|---|---|
| A | 94205 | 1137 | 1.206942% |
| B | 94205 | 1353 | 1.436229% |
| C | 94205 | 3556 | 3.774747% |
| D | 94205 | 3389 | 3.597474% |
Noise dominated data is calculated using 1-second bins in cleaned event files. If a bin has >2000 counts, and if more than 50% of those come from <1% of pixels, then it is considered to be noise-dominated and hence unusable.
| Quadrant | # 1 sec bins | Bins with >0 counts | Bins with >2000 counts | High rate bins dominated by noise | Noise dominated (total time) | Noise dominated (detector-on time) | Marked lightcurve |
|---|---|---|---|---|---|---|---|
| A | 109025 | 94207 | 1 | 1 | 0.00% | 0.00% |  |
| B | 109025 | 94208 | 6 | 6 | 0.01% | 0.01% |  |
| C | 109025 | 94208 | 302 | 302 | 0.28% | 0.32% |  |
| D | 109025 | 94206 | 558 | 558 | 0.51% | 0.59% |  |
Top three noisy pixels from each quadrant. If the there are fewer than three noisy pixels in the level2.evt file, extra rows are filled as -1
| Pixel properties | Quadrant properties | ||||||
|---|---|---|---|---|---|---|---|
| Quadrant | DetID | PixID | Counts | Sigma | Mean | Median | Sigma |
| A | 15 | 223 | 419764 | 378.69 | 5106 | 5038 | 1095.2 |
| A | 13 | 254 | 142002 | 125.06 | 5106 | 5038 | 1095.2 |
| A | 15 | 239 | 108326 | 94.31 | 5106 | 5038 | 1095.2 |
| B | 0 | 230 | 210265 | 211.76 | 5142 | 5032 | 969.2 |
| B | 0 | 189 | 207184 | 208.58 | 5142 | 5032 | 969.2 |
| B | 4 | 216 | 174587 | 174.95 | 5142 | 5032 | 969.2 |
| C | 7 | 247 | 10030174 | 8700.41 | 4892 | 4888 | 1152.3 |
| C | 2 | 16 | 504795 | 433.84 | 4892 | 4888 | 1152.3 |
| C | 10 | 218 | 190099 | 160.73 | 4892 | 4888 | 1152.3 |
| D | 1 | 52 | 5613550 | 4841.76 | 4995 | 4839 | 1158.4 |
| D | 7 | 238 | 2287133 | 1970.21 | 4995 | 4839 | 1158.4 |
| D | 8 | 195 | 1793227 | 1543.84 | 4995 | 4839 | 1158.4 |
Histogram calculated using DETX and DETY for each event in the final _common_clean file
| Quadrant A |  |
 |
Quadrant B |
|---|---|---|---|
| Quadrant D |  |
 |
Quadrant C |
| Plot type | Count rate plots | Images |
|---|---|---|
| Comparison with Poisson distribution Blue bars denote a histogram of data divided into 1 sec bins. Red curve is a Poisson curve with rate = median count rate of data. |
 |
 |
| Quadrant-wise count rates Data is divided into 100 sec bins |
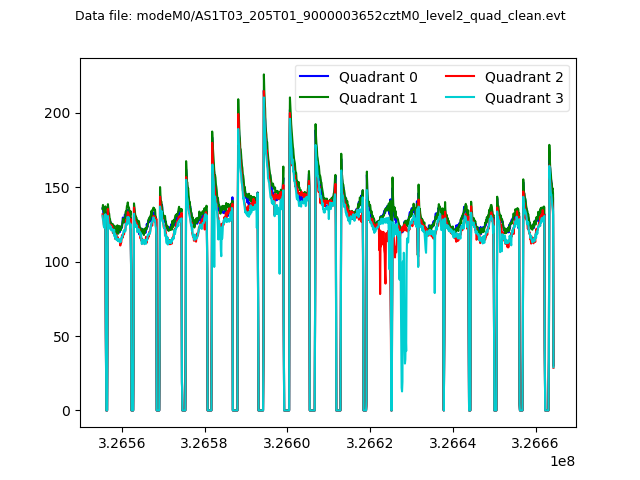 |
|
| Module-wise count rates for Quadrant A Data is divided into 100 sec bins |
 |
 |
| Module-wise count rates for Quadrant B Data is divided into 100 sec bins |
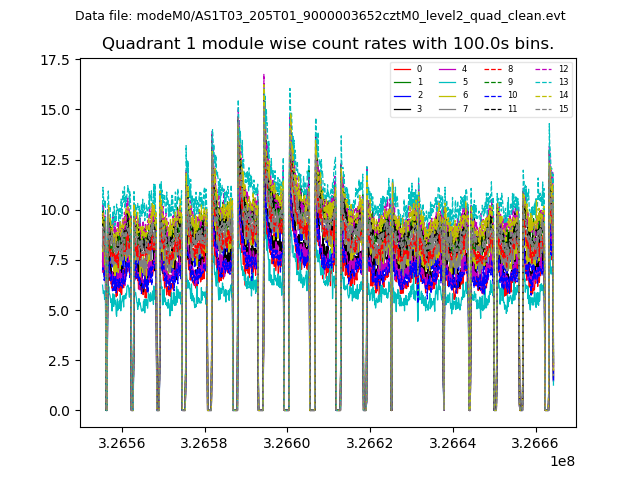 |
 |
| Module-wise count rates for Quadrant C Data is divided into 100 sec bins |
 |
 |
| Module-wise count rates for Quadrant D Data is divided into 100 sec bins |
 |
 |
| Parameter | Plot |
|---|---|
| CZT HV Monitor |  |
| D_VDD |  |
| Temperature 1 |  |
| Veto HV Monitor | 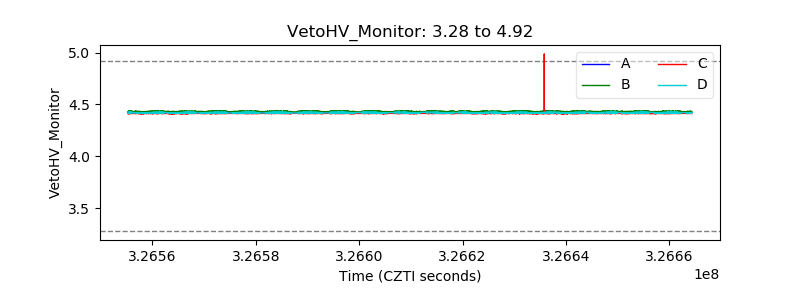 |
| Veto LLD |  |
| Alpha Counter |  |
| _CPM_Rate |  |
| CZT Counter | 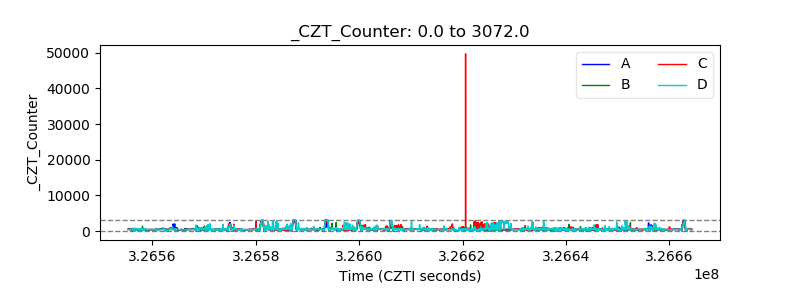 |
| +2.5 Volts monitor |  |
| +5 Volts monitor |  |
| _ROLL_ROT |  |
| _Roll_DEC |  |
| _Roll_RA | 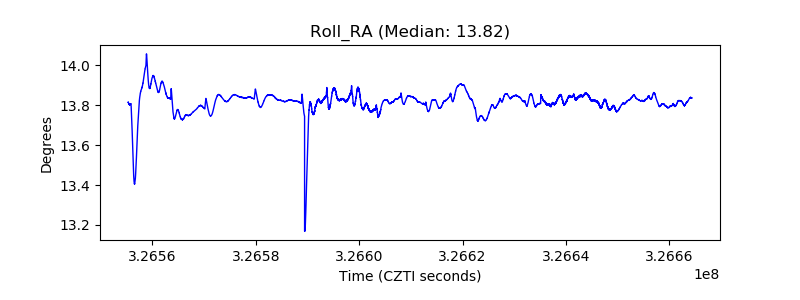 |
| Veto Counter |  |