| Param | Original file | Final file |
|---|---|---|
| Filename | modeM0/AS1A08_003T16_9000003650cztM0_level2_bc.evt | modeM0/AS1A08_003T16_9000003650cztM0_level2_quad_clean.evt |
| Size (bytes) | 1,638,910,080 | 565,427,520 |
| Size | 1.5 GB | 539.2 MB |
| Events in quadrant A | 9,973,253 | 3,603,134 |
| Events in quadrant B | 10,238,467 | 3,679,946 |
| Events in quadrant C | 13,641,241 | 3,425,869 |
| Events in quadrant D | 12,730,684 | 3,346,730 |
| Mode SS | |||
|---|---|---|---|
| Quadrant | BADHDUFLAG | Total packets | Discarded packets |
| A | 0 | 910 | 0 |
| B | 0 | 910 | 0 |
| C | 0 | 910 | 0 |
| D | 0 | 910 | 0 |
| Mode M0 | |||
|---|---|---|---|
| Quadrant | BADHDUFLAG | Total packets | Discarded packets |
| A | 0 | 93916 | 0 |
| B | 0 | 95213 | 0 |
| C | 0 | 108793 | 0 |
| D | 0 | 103127 | 0 |
| Mode M9 | |||
|---|---|---|---|
| Quadrant | BADHDUFLAG | Total packets | Discarded packets |
| A | 0 | 73 | 0 |
| B | 0 | 73 | 0 |
| C | 0 | 73 | 0 |
| D | 0 | 73 | 0 |
| Quadrant | Total seconds | Saturated seconds | Saturation percentage |
|---|---|---|---|
| A | 44733 | 667 | 1.491069% |
| B | 44733 | 763 | 1.705676% |
| C | 44733 | 1212 | 2.709409% |
| D | 44733 | 673 | 1.504482% |
Noise dominated data is calculated using 1-second bins in cleaned event files. If a bin has >2000 counts, and if more than 50% of those come from <1% of pixels, then it is considered to be noise-dominated and hence unusable.
| Quadrant | # 1 sec bins | Bins with >0 counts | Bins with >2000 counts | High rate bins dominated by noise | Noise dominated (total time) | Noise dominated (detector-on time) | Marked lightcurve |
|---|---|---|---|---|---|---|---|
| A | 52093 | 44733 | 1 | 1 | 0.00% | 0.00% |  |
| B | 52093 | 44733 | 5 | 5 | 0.01% | 0.01% |  |
| C | 52093 | 44733 | 67 | 67 | 0.13% | 0.15% |  |
| D | 52093 | 44731 | 43 | 43 | 0.08% | 0.10% |  |
Top three noisy pixels from each quadrant. If the there are fewer than three noisy pixels in the level2.evt file, extra rows are filled as -1
| Pixel properties | Quadrant properties | ||||||
|---|---|---|---|---|---|---|---|
| Quadrant | DetID | PixID | Counts | Sigma | Mean | Median | Sigma |
| A | 15 | 223 | 205361 | 383.74 | 2504 | 2464 | 528.7 |
| A | 13 | 254 | 64714 | 117.73 | 2504 | 2464 | 528.7 |
| A | 15 | 239 | 55212 | 99.76 | 2504 | 2464 | 528.7 |
| B | 0 | 189 | 266146 | 563.3 | 2542 | 2484 | 468.1 |
| B | 4 | 80 | 117129 | 244.93 | 2542 | 2484 | 468.1 |
| B | 0 | 190 | 61859 | 126.85 | 2542 | 2484 | 468.1 |
| C | 7 | 247 | 4403105 | 7947.41 | 2382 | 2375 | 553.7 |
| C | 2 | 16 | 48310 | 82.96 | 2382 | 2375 | 553.7 |
| C | 0 | 10 | 27346 | 45.1 | 2382 | 2375 | 553.7 |
| D | 1 | 52 | 2000714 | 3633.98 | 2419 | 2340 | 549.9 |
| D | 8 | 195 | 569164 | 1030.75 | 2419 | 2340 | 549.9 |
| D | 2 | 244 | 348815 | 630.05 | 2419 | 2340 | 549.9 |
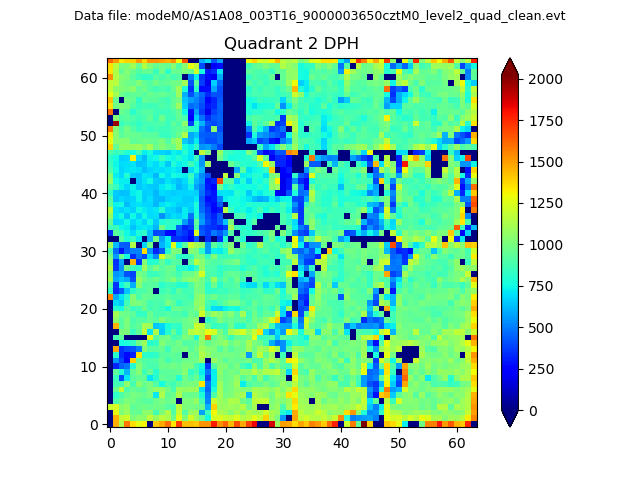
Histogram calculated using DETX and DETY for each event in the final _common_clean file
| Quadrant A |  |
 |
Quadrant B |
|---|---|---|---|
| Quadrant D |  |
 |
Quadrant C |
| Plot type | Count rate plots | Images |
|---|---|---|
| Comparison with Poisson distribution Blue bars denote a histogram of data divided into 1 sec bins. Red curve is a Poisson curve with rate = median count rate of data. |
 |
 |
| Quadrant-wise count rates Data is divided into 100 sec bins |
 |
|
| Module-wise count rates for Quadrant A Data is divided into 100 sec bins |
 |
 |
| Module-wise count rates for Quadrant B Data is divided into 100 sec bins |
 |
 |
| Module-wise count rates for Quadrant C Data is divided into 100 sec bins |
 |
 |
| Module-wise count rates for Quadrant D Data is divided into 100 sec bins |
 |
 |
| Parameter | Plot |
|---|---|
| CZT HV Monitor | 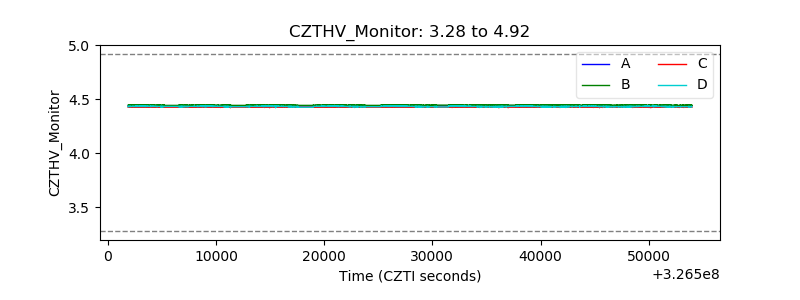 |
| D_VDD |  |
| Temperature 1 |  |
| Veto HV Monitor |  |
| Veto LLD | 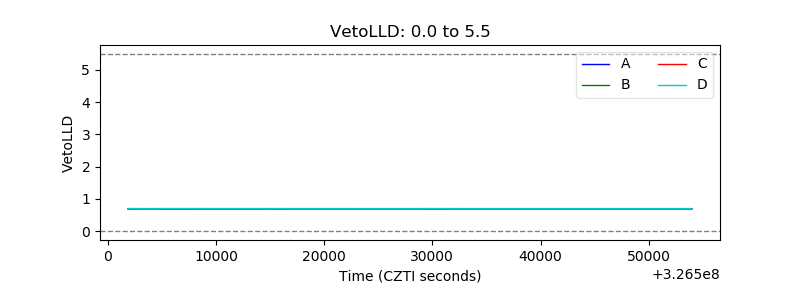 |
| Alpha Counter |  |
| _CPM_Rate |  |
| CZT Counter |  |
| +2.5 Volts monitor |  |
| +5 Volts monitor |  |
| _ROLL_ROT |  |
| _Roll_DEC |  |
| _Roll_RA |  |
| Veto Counter |  |