| Param | Original file | Final file |
|---|---|---|
| Filename | modeM0/AS1A08_003T15_9000003648cztM0_level2_bc.evt | modeM0/AS1A08_003T15_9000003648cztM0_level2_quad_clean.evt |
| Size (bytes) | 1,030,360,320 | 366,390,720 |
| Size | 982.6 MB | 349.4 MB |
| Events in quadrant A | 6,453,981 | 2,303,650 |
| Events in quadrant B | 6,378,230 | 2,341,013 |
| Events in quadrant C | 6,265,211 | 2,219,901 |
| Events in quadrant D | 10,051,246 | 2,164,874 |
| Mode M0 | |||
|---|---|---|---|
| Quadrant | BADHDUFLAG | Total packets | Discarded packets |
| A | 0 | 63409 | 0 |
| B | 0 | 62971 | 0 |
| C | 0 | 63533 | 0 |
| D | 0 | 74169 | 0 |
| Mode SS | |||
|---|---|---|---|
| Quadrant | BADHDUFLAG | Total packets | Discarded packets |
| A | 0 | 618 | 0 |
| B | 0 | 618 | 0 |
| C | 0 | 618 | 0 |
| D | 0 | 618 | 0 |
| Mode M9 | |||
|---|---|---|---|
| Quadrant | BADHDUFLAG | Total packets | Discarded packets |
| A | 0 | 43 | 0 |
| B | 0 | 43 | 0 |
| C | 0 | 43 | 0 |
| D | 0 | 43 | 0 |
| Quadrant | Total seconds | Saturated seconds | Saturation percentage |
|---|---|---|---|
| A | 30080 | 513 | 1.705452% |
| B | 30080 | 453 | 1.505984% |
| C | 30080 | 617 | 2.051197% |
| D | 30080 | 622 | 2.067819% |
Noise dominated data is calculated using 1-second bins in cleaned event files. If a bin has >2000 counts, and if more than 50% of those come from <1% of pixels, then it is considered to be noise-dominated and hence unusable.
| Quadrant | # 1 sec bins | Bins with >0 counts | Bins with >2000 counts | High rate bins dominated by noise | Noise dominated (total time) | Noise dominated (detector-on time) | Marked lightcurve |
|---|---|---|---|---|---|---|---|
| A | 34435 | 30082 | 25 | 25 | 0.07% | 0.08% |  |
| B | 34435 | 30081 | 2 | 2 | 0.01% | 0.01% | 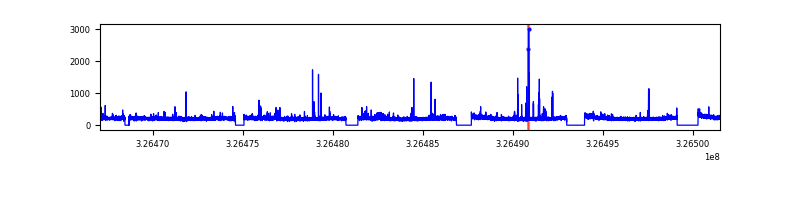 |
| C | 34435 | 30081 | 0 | 0 | 0.00% | 0.00% |  |
| D | 34435 | 30082 | 54 | 54 | 0.16% | 0.18% |  |
Top three noisy pixels from each quadrant. If the there are fewer than three noisy pixels in the level2.evt file, extra rows are filled as -1
| Pixel properties | Quadrant properties | ||||||
|---|---|---|---|---|---|---|---|
| Quadrant | DetID | PixID | Counts | Sigma | Mean | Median | Sigma |
| A | 6 | 16 | 365030 | 1052.69 | 1568 | 1536 | 345.3 |
| A | 13 | 254 | 45573 | 127.53 | 1568 | 1536 | 345.3 |
| A | 4 | 2 | 27648 | 75.62 | 1568 | 1536 | 345.3 |
| B | 7 | 202 | 81520 | 266.86 | 1586 | 1547 | 299.7 |
| B | 0 | 189 | 72737 | 237.55 | 1586 | 1547 | 299.7 |
| B | 4 | 80 | 70445 | 229.9 | 1586 | 1547 | 299.7 |
| C | 7 | 247 | 244862 | 679.86 | 1511 | 1499 | 358.0 |
| C | 2 | 16 | 125043 | 345.13 | 1511 | 1499 | 358.0 |
| C | 5 | 112 | 74049 | 202.68 | 1511 | 1499 | 358.0 |
| D | 1 | 52 | 2259250 | 6334.7 | 1534 | 1477 | 356.4 |
| D | 8 | 195 | 1299328 | 3641.42 | 1534 | 1477 | 356.4 |
| D | 7 | 238 | 374428 | 1046.4 | 1534 | 1477 | 356.4 |
Histogram calculated using DETX and DETY for each event in the final _common_clean file
| Quadrant A |  |
 |
Quadrant B |
|---|---|---|---|
| Quadrant D |  |
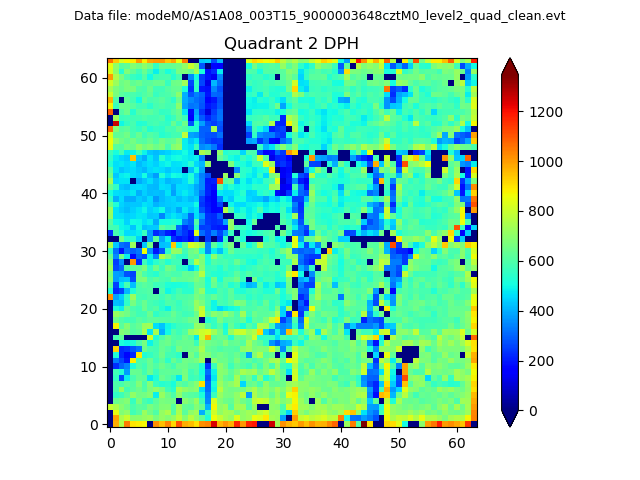 |
Quadrant C |
| Plot type | Count rate plots | Images |
|---|---|---|
| Comparison with Poisson distribution Blue bars denote a histogram of data divided into 1 sec bins. Red curve is a Poisson curve with rate = median count rate of data. |
 |
 |
| Quadrant-wise count rates Data is divided into 100 sec bins |
 |
|
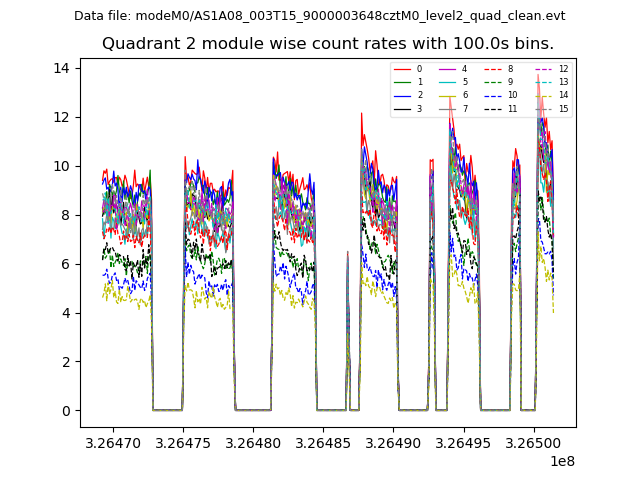
| Module-wise count rates for Quadrant A Data is divided into 100 sec bins |
 |
 |
| Module-wise count rates for Quadrant B Data is divided into 100 sec bins |
 |
 |
| Module-wise count rates for Quadrant C Data is divided into 100 sec bins |
 |
 |
| Module-wise count rates for Quadrant D Data is divided into 100 sec bins |
 |
 |
| Parameter | Plot |
|---|---|
| CZT HV Monitor |  |
| D_VDD |  |
| Temperature 1 |  |
| Veto HV Monitor | 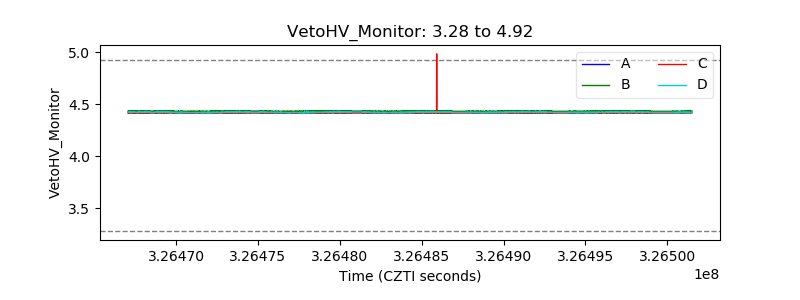 |
| Veto LLD |  |
| Alpha Counter |  |
| _CPM_Rate | 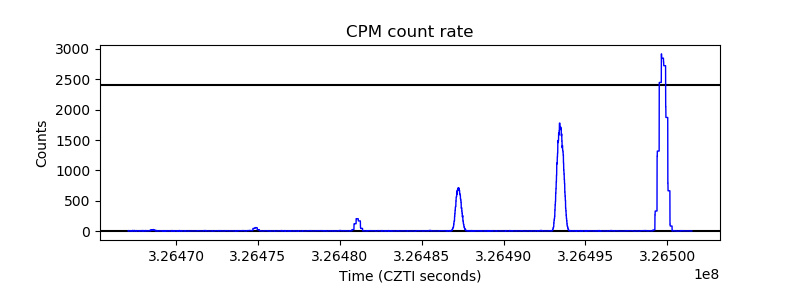 |
| CZT Counter |  |
| +2.5 Volts monitor |  |
| +5 Volts monitor | 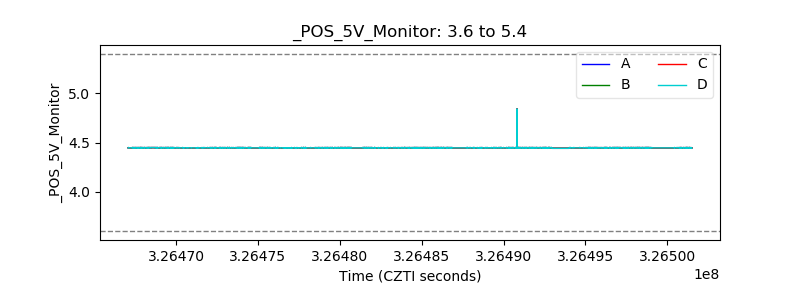 |
| _ROLL_ROT | 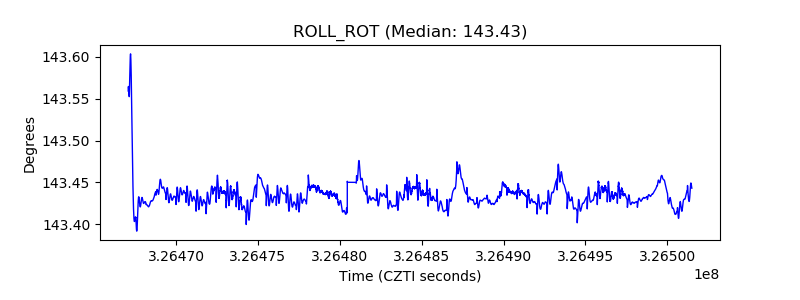 |
| _Roll_DEC |  |
| _Roll_RA |  |
| Veto Counter |  |