| Param | Original file | Final file |
|---|---|---|
| Filename | modeM0/AS1A08_003T13_9000003646cztM0_level2_bc.evt | modeM0/AS1A08_003T13_9000003646cztM0_level2_quad_clean.evt |
| Size (bytes) | 1,692,112,320 | 570,859,200 |
| Size | 1.6 GB | 544.4 MB |
| Events in quadrant A | 10,513,196 | 3,662,886 |
| Events in quadrant B | 10,280,916 | 3,741,526 |
| Events in quadrant C | 10,487,069 | 3,498,783 |
| Events in quadrant D | 16,897,078 | 3,300,276 |
| Mode SS | |||
|---|---|---|---|
| Quadrant | BADHDUFLAG | Total packets | Discarded packets |
| A | 0 | 918 | 0 |
| B | 0 | 918 | 0 |
| C | 0 | 918 | 0 |
| D | 0 | 918 | 0 |
| Mode M0 | |||
|---|---|---|---|
| Quadrant | BADHDUFLAG | Total packets | Discarded packets |
| A | 0 | 96117 | 0 |
| B | 0 | 95224 | 0 |
| C | 0 | 97088 | 0 |
| D | 0 | 117116 | 0 |
| Mode M9 | |||
|---|---|---|---|
| Quadrant | BADHDUFLAG | Total packets | Discarded packets |
| A | 0 | 78 | 0 |
| B | 0 | 78 | 0 |
| C | 0 | 78 | 0 |
| D | 0 | 78 | 0 |
| Quadrant | Total seconds | Saturated seconds | Saturation percentage |
|---|---|---|---|
| A | 44972 | 854 | 1.898959% |
| B | 44972 | 783 | 1.741083% |
| C | 44972 | 986 | 2.192475% |
| D | 44972 | 2126 | 4.727386% |
Noise dominated data is calculated using 1-second bins in cleaned event files. If a bin has >2000 counts, and if more than 50% of those come from <1% of pixels, then it is considered to be noise-dominated and hence unusable.
| Quadrant | # 1 sec bins | Bins with >0 counts | Bins with >2000 counts | High rate bins dominated by noise | Noise dominated (total time) | Noise dominated (detector-on time) | Marked lightcurve |
|---|---|---|---|---|---|---|---|
| A | 52717 | 44974 | 57 | 57 | 0.11% | 0.13% | 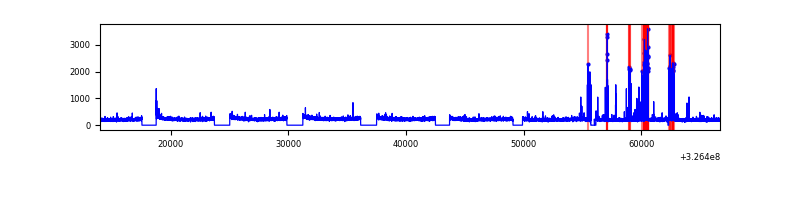 |
| B | 52717 | 44972 | 3 | 3 | 0.01% | 0.01% |  |
| C | 52717 | 44975 | 52 | 52 | 0.10% | 0.12% |  |
| D | 52717 | 44973 | 635 | 635 | 1.20% | 1.41% |  |
Top three noisy pixels from each quadrant. If the there are fewer than three noisy pixels in the level2.evt file, extra rows are filled as -1
| Pixel properties | Quadrant properties | ||||||
|---|---|---|---|---|---|---|---|
| Quadrant | DetID | PixID | Counts | Sigma | Mean | Median | Sigma |
| A | 6 | 16 | 666020 | 1227.17 | 2533 | 2493 | 540.7 |
| A | 13 | 254 | 64426 | 114.54 | 2533 | 2493 | 540.7 |
| A | 4 | 2 | 61233 | 108.64 | 2533 | 2493 | 540.7 |
| B | 4 | 80 | 116675 | 239.28 | 2578 | 2521 | 477.1 |
| B | 7 | 202 | 96216 | 196.39 | 2578 | 2521 | 477.1 |
| B | 0 | 190 | 79330 | 161.0 | 2578 | 2521 | 477.1 |
| C | 7 | 247 | 375937 | 666.54 | 2419 | 2411 | 560.4 |
| C | 2 | 16 | 359641 | 637.46 | 2419 | 2411 | 560.4 |
| C | 5 | 112 | 292822 | 518.22 | 2419 | 2411 | 560.4 |
| D | 1 | 52 | 2742289 | 4950.83 | 2411 | 2328 | 553.4 |
| D | 7 | 238 | 2665106 | 4811.37 | 2411 | 2328 | 553.4 |
| D | 8 | 195 | 2030987 | 3665.58 | 2411 | 2328 | 553.4 |
Histogram calculated using DETX and DETY for each event in the final _common_clean file
| Quadrant A |  |
 |
Quadrant B |
|---|---|---|---|
| Quadrant D |  |
 |
Quadrant C |
| Plot type | Count rate plots | Images |
|---|---|---|
| Comparison with Poisson distribution Blue bars denote a histogram of data divided into 1 sec bins. Red curve is a Poisson curve with rate = median count rate of data. |
 |
 |
| Quadrant-wise count rates Data is divided into 100 sec bins |
 |
|
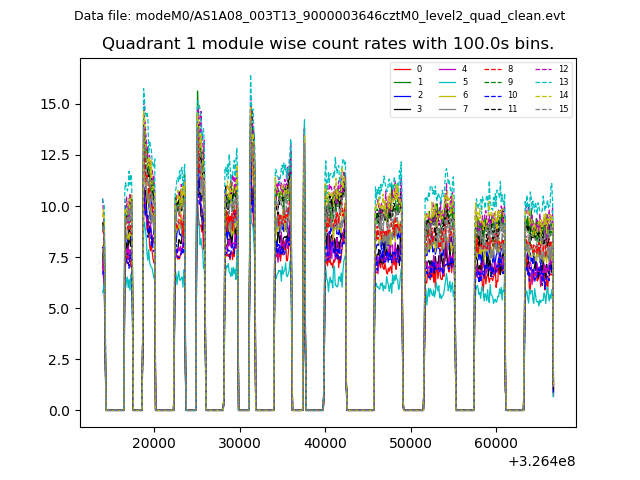
| Module-wise count rates for Quadrant A Data is divided into 100 sec bins |
 |
 |
| Module-wise count rates for Quadrant B Data is divided into 100 sec bins |
 |
 |
| Module-wise count rates for Quadrant C Data is divided into 100 sec bins |
 |
 |
| Module-wise count rates for Quadrant D Data is divided into 100 sec bins |
 |
 |
| Parameter | Plot |
|---|---|
| CZT HV Monitor |  |
| D_VDD |  |
| Temperature 1 |  |
| Veto HV Monitor |  |
| Veto LLD | 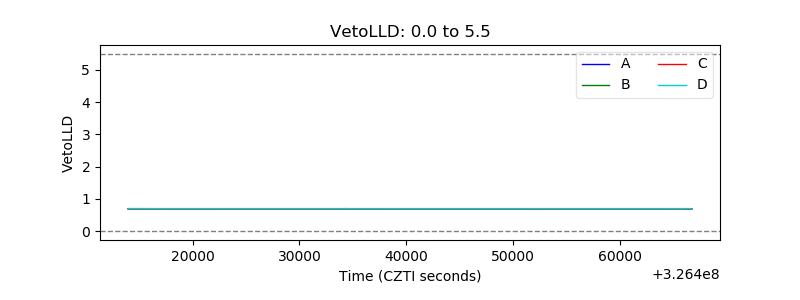 |
| Alpha Counter | 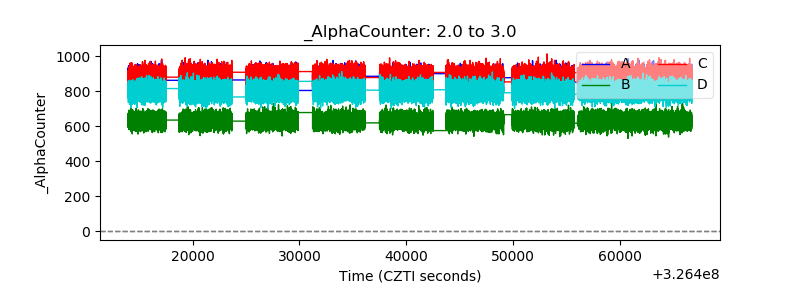 |
| _CPM_Rate |  |
| CZT Counter |  |
| +2.5 Volts monitor |  |
| +5 Volts monitor | 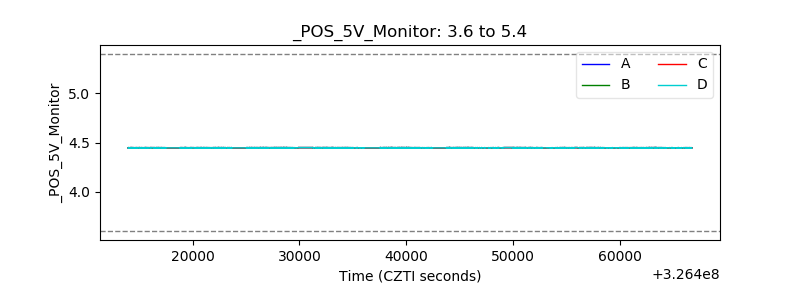 |
| _ROLL_ROT |  |
| _Roll_DEC |  |
| _Roll_RA |  |
| Veto Counter |  |