| Param | Original file | Final file |
|---|---|---|
| Filename | modeM0/AS1A08_003T09_9000003644cztM0_level2_bc.evt | modeM0/AS1A08_003T09_9000003644cztM0_level2_quad_clean.evt |
| Size (bytes) | 1,037,208,960 | 362,062,080 |
| Size | 989.2 MB | 345.3 MB |
| Events in quadrant A | 6,988,699 | 2,273,451 |
| Events in quadrant B | 6,034,081 | 2,312,454 |
| Events in quadrant C | 6,663,505 | 2,201,455 |
| Events in quadrant D | 9,718,907 | 2,160,031 |
| Mode M9 | |||
|---|---|---|---|
| Quadrant | BADHDUFLAG | Total packets | Discarded packets |
| A | 0 | 40 | 0 |
| B | 0 | 40 | 0 |
| C | 0 | 40 | 0 |
| D | 0 | 40 | 0 |
| Mode M0 | |||
|---|---|---|---|
| Quadrant | BADHDUFLAG | Total packets | Discarded packets |
| A | 0 | 64661 | 0 |
| B | 0 | 61080 | 0 |
| C | 0 | 63257 | 0 |
| D | 0 | 72138 | 0 |
| Mode SS | |||
|---|---|---|---|
| Quadrant | BADHDUFLAG | Total packets | Discarded packets |
| A | 0 | 598 | 0 |
| B | 0 | 598 | 0 |
| C | 0 | 598 | 0 |
| D | 0 | 598 | 0 |
| Quadrant | Total seconds | Saturated seconds | Saturation percentage |
|---|---|---|---|
| A | 29376 | 821 | 2.794798% |
| B | 29376 | 427 | 1.453568% |
| C | 29376 | 712 | 2.423747% |
| D | 29376 | 524 | 1.783769% |
Noise dominated data is calculated using 1-second bins in cleaned event files. If a bin has >2000 counts, and if more than 50% of those come from <1% of pixels, then it is considered to be noise-dominated and hence unusable.
| Quadrant | # 1 sec bins | Bins with >0 counts | Bins with >2000 counts | High rate bins dominated by noise | Noise dominated (total time) | Noise dominated (detector-on time) | Marked lightcurve |
|---|---|---|---|---|---|---|---|
| A | 33316 | 29379 | 85 | 85 | 0.26% | 0.29% |  |
| B | 33316 | 29377 | 0 | 0 | 0.00% | 0.00% |  |
| C | 33316 | 29378 | 42 | 42 | 0.13% | 0.14% |  |
| D | 33316 | 29377 | 51 | 51 | 0.15% | 0.17% | 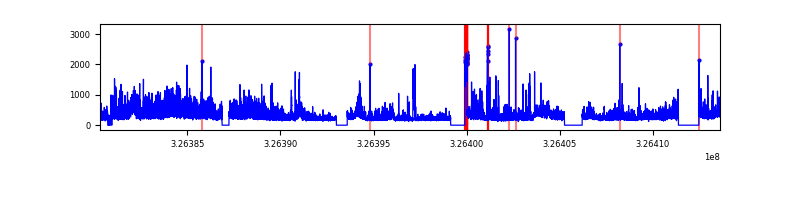 |
Top three noisy pixels from each quadrant. If the there are fewer than three noisy pixels in the level2.evt file, extra rows are filled as -1
| Pixel properties | Quadrant properties | ||||||
|---|---|---|---|---|---|---|---|
| Quadrant | DetID | PixID | Counts | Sigma | Mean | Median | Sigma |
| A | 6 | 16 | 1107685 | 3368.81 | 1507 | 1478 | 328.4 |
| A | 4 | 2 | 46545 | 137.25 | 1507 | 1478 | 328.4 |
| A | 13 | 254 | 43606 | 128.3 | 1507 | 1478 | 328.4 |
| B | 7 | 202 | 44640 | 147.25 | 1530 | 1490 | 293.0 |
| B | 0 | 190 | 40788 | 134.1 | 1530 | 1490 | 293.0 |
| B | 0 | 189 | 32978 | 107.45 | 1530 | 1490 | 293.0 |
| C | 7 | 247 | 758678 | 2197.2 | 1460 | 1450 | 344.6 |
| C | 2 | 16 | 243374 | 701.98 | 1460 | 1450 | 344.6 |
| C | 8 | 128 | 13916 | 36.17 | 1460 | 1450 | 344.6 |
| D | 8 | 195 | 2121280 | 6030.24 | 1493 | 1435 | 351.5 |
| D | 7 | 238 | 915865 | 2601.24 | 1493 | 1435 | 351.5 |
| D | 1 | 52 | 708380 | 2011.02 | 1493 | 1435 | 351.5 |
Histogram calculated using DETX and DETY for each event in the final _common_clean file
| Quadrant A |  |
 |
Quadrant B |
|---|---|---|---|
| Quadrant D |  |
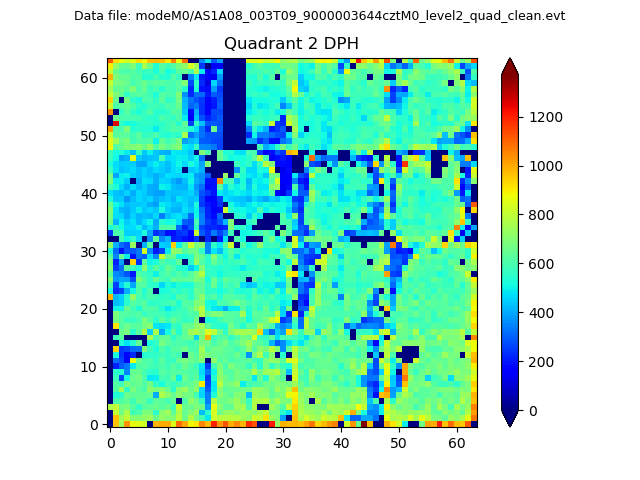 |
Quadrant C |
| Plot type | Count rate plots | Images |
|---|---|---|
| Comparison with Poisson distribution Blue bars denote a histogram of data divided into 1 sec bins. Red curve is a Poisson curve with rate = median count rate of data. |
 |
 |
| Quadrant-wise count rates Data is divided into 100 sec bins |
 |
|
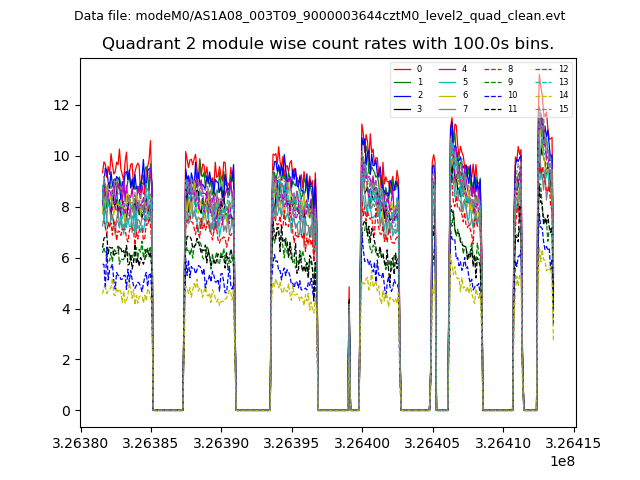
| Module-wise count rates for Quadrant A Data is divided into 100 sec bins |
 |
 |
| Module-wise count rates for Quadrant B Data is divided into 100 sec bins |
 |
 |
| Module-wise count rates for Quadrant C Data is divided into 100 sec bins |
 |
 |
| Module-wise count rates for Quadrant D Data is divided into 100 sec bins |
 |
 |
| Parameter | Plot |
|---|---|
| CZT HV Monitor |  |
| D_VDD |  |
| Temperature 1 |  |
| Veto HV Monitor |  |
| Veto LLD |  |
| Alpha Counter |  |
| _CPM_Rate | 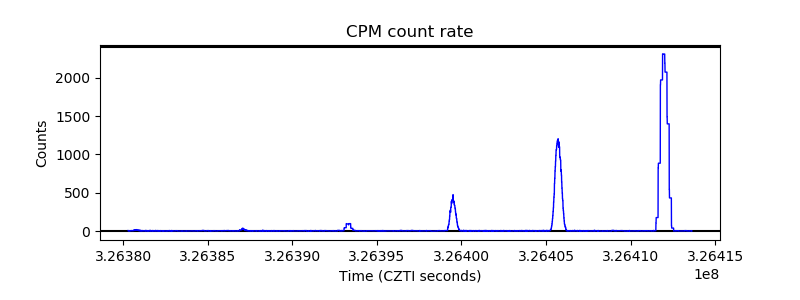 |
| CZT Counter | 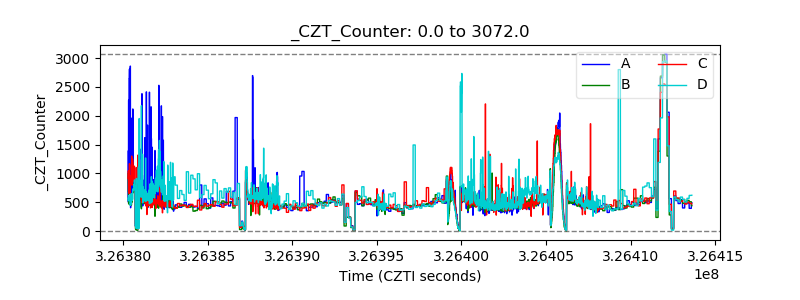 |
| +2.5 Volts monitor |  |
| +5 Volts monitor | 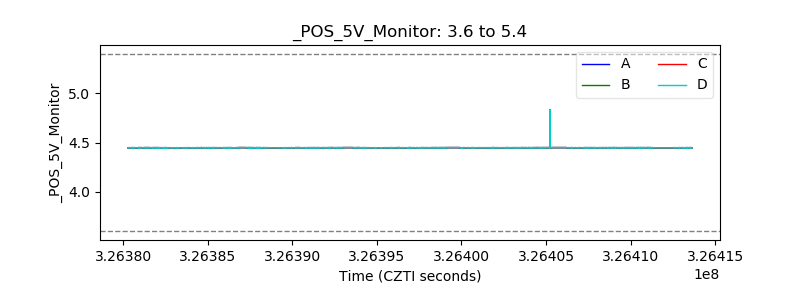 |
| _ROLL_ROT |  |
| _Roll_DEC | 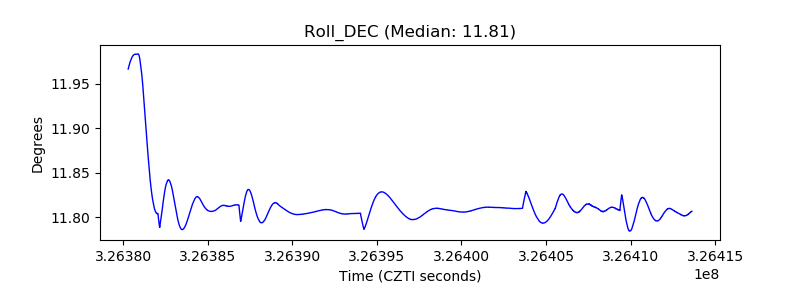 |
| _Roll_RA |  |
| Veto Counter |  |