| Param | Original file | Final file |
|---|---|---|
| Filename | modeM0/AS1A07_027T16_9000003642cztM0_level2_bc.evt | modeM0/AS1A07_027T16_9000003642cztM0_level2_quad_clean.evt |
| Size (bytes) | 2,677,538,880 | 876,078,720 |
| Size | 2.5 GB | 835.5 MB |
| Events in quadrant A | 13,840,392 | 5,729,546 |
| Events in quadrant B | 13,067,954 | 5,827,273 |
| Events in quadrant C | 23,383,679 | 5,507,837 |
| Events in quadrant D | 26,790,638 | 5,433,473 |
| Mode M9 | |||
|---|---|---|---|
| Quadrant | BADHDUFLAG | Total packets | Discarded packets |
| A | 0 | 107 | 0 |
| B | 0 | 107 | 0 |
| C | 0 | 107 | 0 |
| D | 0 | 107 | 0 |
| Mode M0 | |||
|---|---|---|---|
| Quadrant | BADHDUFLAG | Total packets | Discarded packets |
| A | 0 | 126383 | 0 |
| B | 0 | 123811 | 0 |
| C | 0 | 158308 | 0 |
| D | 0 | 168856 | 0 |
| Mode SS | |||
|---|---|---|---|
| Quadrant | BADHDUFLAG | Total packets | Discarded packets |
| A | 0 | 1198 | 0 |
| B | 0 | 1198 | 0 |
| C | 0 | 1198 | 0 |
| D | 0 | 1198 | 0 |
| Quadrant | Total seconds | Saturated seconds | Saturation percentage |
|---|---|---|---|
| A | 58864 | 718 | 1.219761% |
| B | 58864 | 658 | 1.117831% |
| C | 58864 | 4181 | 7.102813% |
| D | 58864 | 3356 | 5.701278% |
Noise dominated data is calculated using 1-second bins in cleaned event files. If a bin has >2000 counts, and if more than 50% of those come from <1% of pixels, then it is considered to be noise-dominated and hence unusable.
| Quadrant | # 1 sec bins | Bins with >0 counts | Bins with >2000 counts | High rate bins dominated by noise | Noise dominated (total time) | Noise dominated (detector-on time) | Marked lightcurve |
|---|---|---|---|---|---|---|---|
| A | 69674 | 58864 | 36 | 36 | 0.05% | 0.06% | 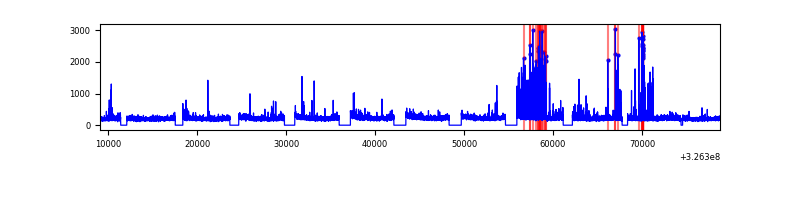 |
| B | 69674 | 58865 | 2 | 2 | 0.00% | 0.00% |  |
| C | 69674 | 58864 | 1679 | 1679 | 2.41% | 2.85% | 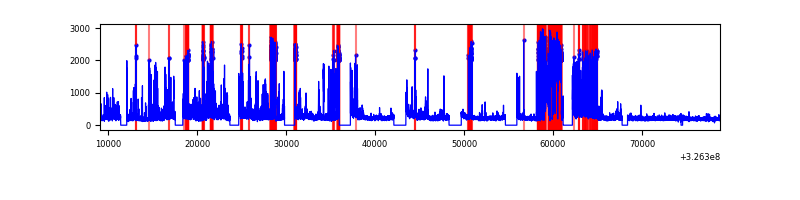 |
| D | 69674 | 58864 | 1168 | 1168 | 1.68% | 1.98% |  |
Top three noisy pixels from each quadrant. If the there are fewer than three noisy pixels in the level2.evt file, extra rows are filled as -1
| Pixel properties | Quadrant properties | ||||||
|---|---|---|---|---|---|---|---|
| Quadrant | DetID | PixID | Counts | Sigma | Mean | Median | Sigma |
| A | 6 | 16 | 1195178 | 1699.48 | 3258 | 3203 | 701.4 |
| A | 13 | 254 | 87978 | 120.87 | 3258 | 3203 | 701.4 |
| A | 11 | 208 | 48086 | 63.99 | 3258 | 3203 | 701.4 |
| B | 0 | 190 | 184652 | 295.4 | 3280 | 3206 | 614.2 |
| B | 4 | 216 | 64711 | 100.13 | 3280 | 3206 | 614.2 |
| B | 3 | 209 | 50667 | 77.27 | 3280 | 3206 | 614.2 |
| C | 7 | 247 | 10029334 | 13759.19 | 3100 | 3092 | 728.7 |
| C | 2 | 16 | 1370552 | 1876.59 | 3100 | 3092 | 728.7 |
| C | 0 | 10 | 38338 | 48.37 | 3100 | 3092 | 728.7 |
| D | 1 | 52 | 8421887 | 11382.92 | 3201 | 3097 | 739.6 |
| D | 8 | 195 | 5526344 | 7467.9 | 3201 | 3097 | 739.6 |
| D | 7 | 238 | 319488 | 427.79 | 3201 | 3097 | 739.6 |
Histogram calculated using DETX and DETY for each event in the final _common_clean file
| Quadrant A |  |
 |
Quadrant B |
|---|---|---|---|
| Quadrant D |  |
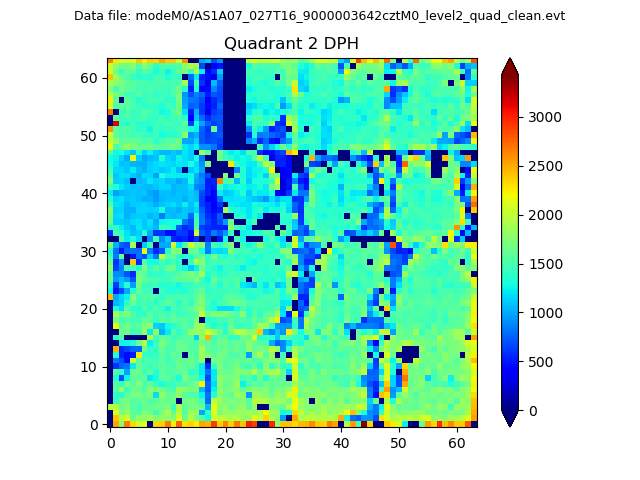 |
Quadrant C |
| Plot type | Count rate plots | Images |
|---|---|---|
| Comparison with Poisson distribution Blue bars denote a histogram of data divided into 1 sec bins. Red curve is a Poisson curve with rate = median count rate of data. |
 |
 |
| Quadrant-wise count rates Data is divided into 100 sec bins |
 |
|
| Module-wise count rates for Quadrant A Data is divided into 100 sec bins |
 |
 |
| Module-wise count rates for Quadrant B Data is divided into 100 sec bins |
 |
 |
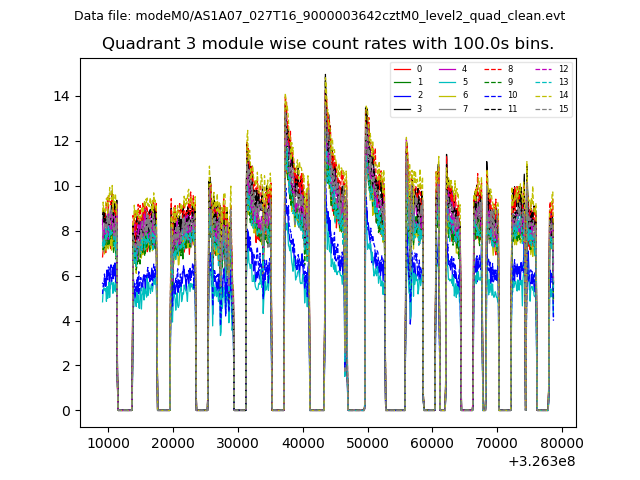
| Module-wise count rates for Quadrant C Data is divided into 100 sec bins |
 |
 |
| Module-wise count rates for Quadrant D Data is divided into 100 sec bins |
 |
 |
| Parameter | Plot |
|---|---|
| CZT HV Monitor |  |
| D_VDD |  |
| Temperature 1 |  |
| Veto HV Monitor |  |
| Veto LLD | 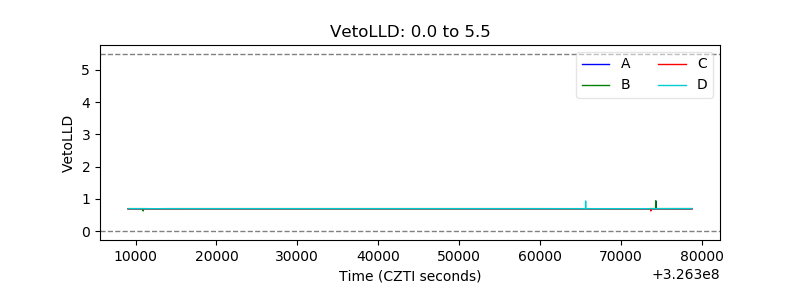 |
| Alpha Counter |  |
| _CPM_Rate |  |
| CZT Counter |  |
| +2.5 Volts monitor |  |
| +5 Volts monitor |  |
| _ROLL_ROT |  |
| _Roll_DEC |  |
| _Roll_RA | 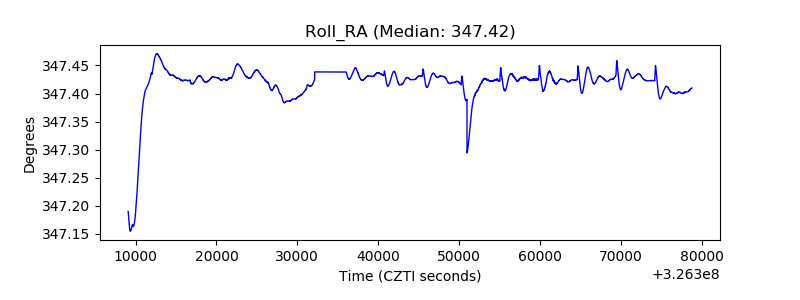 |
| Veto Counter | 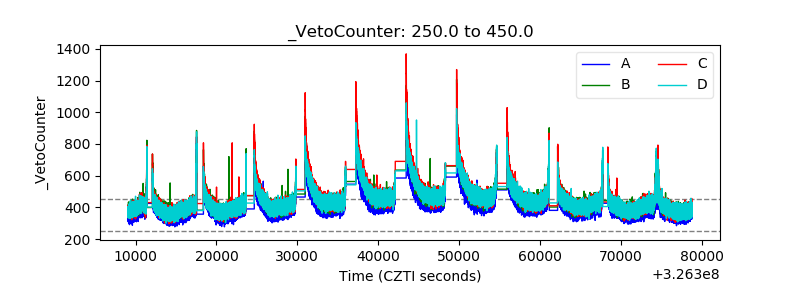 |