| Param | Original file | Final file |
|---|---|---|
| Filename | modeM0/AS1A07_027T02_9000003640cztM0_level2_bc.evt | modeM0/AS1A07_027T02_9000003640cztM0_level2_quad_clean.evt |
| Size (bytes) | 2,738,203,200 | 895,242,240 |
| Size | 2.6 GB | 853.8 MB |
| Events in quadrant A | 16,068,877 | 5,777,738 |
| Events in quadrant B | 14,478,401 | 5,888,391 |
| Events in quadrant C | 22,125,879 | 5,576,994 |
| Events in quadrant D | 25,957,970 | 5,544,832 |
| Mode M9 | |||
|---|---|---|---|
| Quadrant | BADHDUFLAG | Total packets | Discarded packets |
| A | 0 | 95 | 0 |
| B | 0 | 95 | 0 |
| C | 0 | 95 | 0 |
| D | 0 | 95 | 0 |
| Mode SS | |||
|---|---|---|---|
| Quadrant | BADHDUFLAG | Total packets | Discarded packets |
| A | 0 | 1284 | 0 |
| B | 0 | 1284 | 0 |
| C | 0 | 1284 | 0 |
| D | 0 | 1284 | 0 |
| Mode M0 | |||
|---|---|---|---|
| Quadrant | BADHDUFLAG | Total packets | Discarded packets |
| A | 0 | 138747 | 0 |
| B | 0 | 133959 | 0 |
| C | 0 | 160162 | 0 |
| D | 0 | 170286 | 0 |
| Quadrant | Total seconds | Saturated seconds | Saturation percentage |
|---|---|---|---|
| A | 63106 | 1265 | 2.004564% |
| B | 63106 | 870 | 1.378633% |
| C | 63105 | 3406 | 5.397354% |
| D | 63105 | 1814 | 2.874574% |
Noise dominated data is calculated using 1-second bins in cleaned event files. If a bin has >2000 counts, and if more than 50% of those come from <1% of pixels, then it is considered to be noise-dominated and hence unusable.
| Quadrant | # 1 sec bins | Bins with >0 counts | Bins with >2000 counts | High rate bins dominated by noise | Noise dominated (total time) | Noise dominated (detector-on time) | Marked lightcurve |
|---|---|---|---|---|---|---|---|
| A | 75425 | 63108 | 266 | 266 | 0.35% | 0.42% |  |
| B | 75425 | 63109 | 14 | 14 | 0.02% | 0.02% |  |
| C | 75425 | 63107 | 1044 | 1044 | 1.38% | 1.65% |  |
| D | 75425 | 63109 | 300 | 300 | 0.40% | 0.48% |  |
Top three noisy pixels from each quadrant. If the there are fewer than three noisy pixels in the level2.evt file, extra rows are filled as -1
| Pixel properties | Quadrant properties | ||||||
|---|---|---|---|---|---|---|---|
| Quadrant | DetID | PixID | Counts | Sigma | Mean | Median | Sigma |
| A | 6 | 16 | 2560671 | 3487.96 | 3442 | 3391 | 733.2 |
| A | 4 | 2 | 96607 | 127.14 | 3442 | 3391 | 733.2 |
| A | 13 | 254 | 88889 | 116.61 | 3442 | 3391 | 733.2 |
| B | 7 | 205 | 348799 | 536.99 | 3473 | 3389 | 643.2 |
| B | 0 | 189 | 250039 | 383.45 | 3473 | 3389 | 643.2 |
| B | 0 | 190 | 203186 | 310.61 | 3473 | 3389 | 643.2 |
| C | 7 | 247 | 8132762 | 10450.89 | 3312 | 3307 | 777.9 |
| C | 2 | 16 | 1151060 | 1475.5 | 3312 | 3307 | 777.9 |
| C | 7 | 220 | 52304 | 62.99 | 3312 | 3307 | 777.9 |
| D | 12 | 218 | 4206829 | 5272.36 | 3432 | 3321 | 797.3 |
| D | 1 | 52 | 3824293 | 4792.56 | 3432 | 3321 | 797.3 |
| D | 8 | 195 | 3725477 | 4668.62 | 3432 | 3321 | 797.3 |
Histogram calculated using DETX and DETY for each event in the final _common_clean file
| Quadrant A |  |
 |
Quadrant B |
|---|---|---|---|
| Quadrant D |  |
 |
Quadrant C |
| Plot type | Count rate plots | Images |
|---|---|---|
| Comparison with Poisson distribution Blue bars denote a histogram of data divided into 1 sec bins. Red curve is a Poisson curve with rate = median count rate of data. |
 |
 |
| Quadrant-wise count rates Data is divided into 100 sec bins |
 |
|
| Module-wise count rates for Quadrant A Data is divided into 100 sec bins |
 |
 |
| Module-wise count rates for Quadrant B Data is divided into 100 sec bins |
 |
 |
| Module-wise count rates for Quadrant C Data is divided into 100 sec bins |
 |
 |
| Module-wise count rates for Quadrant D Data is divided into 100 sec bins |
 |
 |
| Parameter | Plot |
|---|---|
| CZT HV Monitor |  |
| D_VDD |  |
| Temperature 1 |  |
| Veto HV Monitor |  |
| Veto LLD |  |
| Alpha Counter | 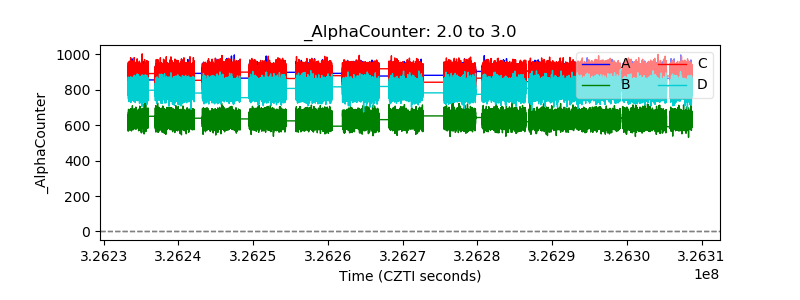 |
| _CPM_Rate |  |
| CZT Counter |  |
| +2.5 Volts monitor |  |
| +5 Volts monitor |  |
| _ROLL_ROT |  |
| _Roll_DEC |  |
| _Roll_RA |  |
| Veto Counter |  |