| Param | Original file | Final file |
|---|---|---|
| Filename | modeM0/AS1A08_003T06_9000003636cztM0_level2_bc.evt | modeM0/AS1A08_003T06_9000003636cztM0_level2_quad_clean.evt |
| Size (bytes) | 1,731,516,480 | 564,577,920 |
| Size | 1.6 GB | 538.4 MB |
| Events in quadrant A | 11,705,938 | 3,610,858 |
| Events in quadrant B | 10,020,213 | 3,702,321 |
| Events in quadrant C | 15,173,944 | 3,405,192 |
| Events in quadrant D | 12,541,757 | 3,363,691 |
| Mode SS | |||
|---|---|---|---|
| Quadrant | BADHDUFLAG | Total packets | Discarded packets |
| A | 0 | 894 | 0 |
| B | 0 | 894 | 0 |
| C | 0 | 894 | 0 |
| D | 0 | 894 | 0 |
| Mode M0 | |||
|---|---|---|---|
| Quadrant | BADHDUFLAG | Total packets | Discarded packets |
| A | 0 | 98006 | 0 |
| B | 0 | 92824 | 0 |
| C | 0 | 113747 | 0 |
| D | 0 | 100784 | 0 |
| Mode M9 | |||
|---|---|---|---|
| Quadrant | BADHDUFLAG | Total packets | Discarded packets |
| A | 0 | 92 | 0 |
| B | 0 | 92 | 0 |
| C | 0 | 92 | 0 |
| D | 0 | 92 | 0 |
| Quadrant | Total seconds | Saturated seconds | Saturation percentage |
|---|---|---|---|
| A | 43976 | 936 | 2.128434% |
| B | 43976 | 508 | 1.155176% |
| C | 43976 | 1605 | 3.649718% |
| D | 43976 | 589 | 1.339367% |
Noise dominated data is calculated using 1-second bins in cleaned event files. If a bin has >2000 counts, and if more than 50% of those come from <1% of pixels, then it is considered to be noise-dominated and hence unusable.
| Quadrant | # 1 sec bins | Bins with >0 counts | Bins with >2000 counts | High rate bins dominated by noise | Noise dominated (total time) | Noise dominated (detector-on time) | Marked lightcurve |
|---|---|---|---|---|---|---|---|
| A | 53082 | 43979 | 305 | 305 | 0.57% | 0.69% |  |
| B | 53082 | 43978 | 1 | 1 | 0.00% | 0.00% | 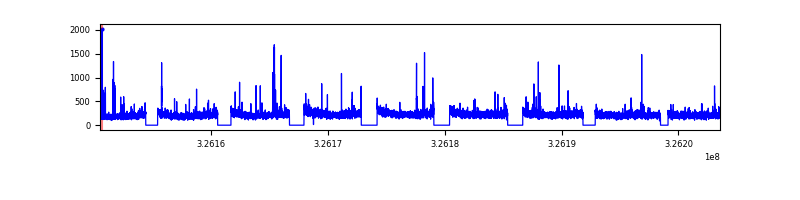 |
| C | 53082 | 43978 | 132 | 132 | 0.25% | 0.30% |  |
| D | 53082 | 43979 | 44 | 44 | 0.08% | 0.10% |  |
Top three noisy pixels from each quadrant. If the there are fewer than three noisy pixels in the level2.evt file, extra rows are filled as -1
| Pixel properties | Quadrant properties | ||||||
|---|---|---|---|---|---|---|---|
| Quadrant | DetID | PixID | Counts | Sigma | Mean | Median | Sigma |
| A | 6 | 16 | 1998976 | 3740.7 | 2511 | 2469 | 533.7 |
| A | 13 | 254 | 61459 | 110.53 | 2511 | 2469 | 533.7 |
| A | 0 | 226 | 15621 | 24.64 | 2511 | 2469 | 533.7 |
| B | 7 | 202 | 65697 | 132.01 | 2558 | 2504 | 478.7 |
| B | 10 | 251 | 58537 | 117.06 | 2558 | 2504 | 478.7 |
| B | 0 | 189 | 45211 | 89.22 | 2558 | 2504 | 478.7 |
| C | 7 | 247 | 4681170 | 8591.44 | 2359 | 2351 | 544.6 |
| C | 2 | 16 | 986036 | 1806.28 | 2359 | 2351 | 544.6 |
| C | 10 | 91 | 329796 | 601.27 | 2359 | 2351 | 544.6 |
| D | 1 | 52 | 2208782 | 4012.74 | 2420 | 2341 | 549.9 |
| D | 12 | 218 | 655563 | 1187.98 | 2420 | 2341 | 549.9 |
| D | 8 | 195 | 274736 | 495.39 | 2420 | 2341 | 549.9 |
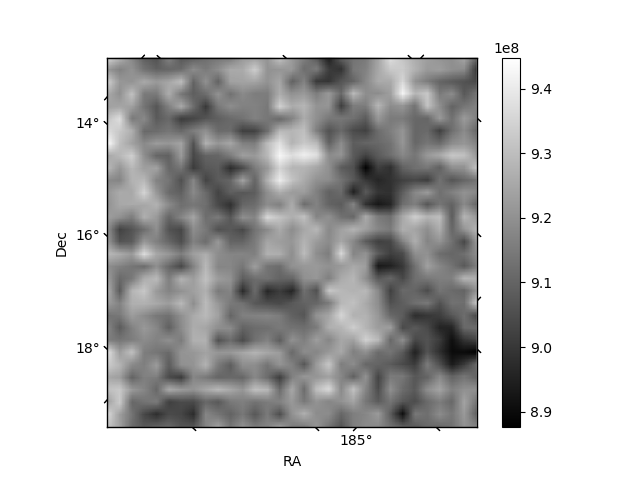
Histogram calculated using DETX and DETY for each event in the final _common_clean file
| Quadrant A | 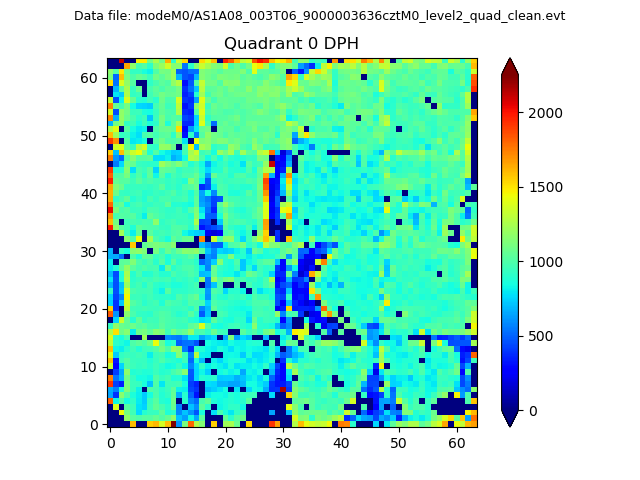 |
 |
Quadrant B |
|---|---|---|---|
| Quadrant D | 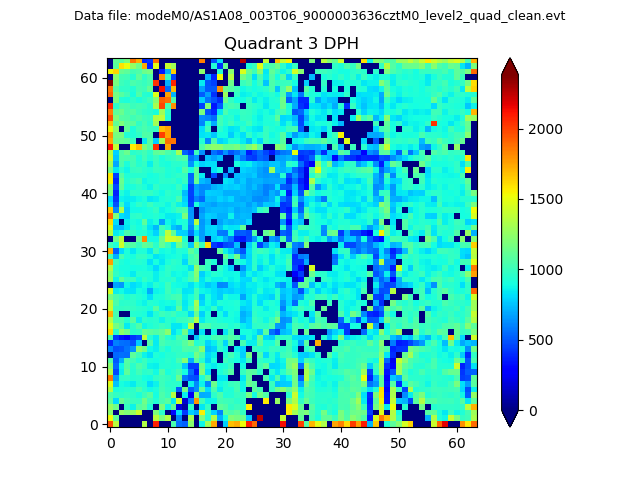 |
 |
Quadrant C |
| Plot type | Count rate plots | Images |
|---|---|---|
| Comparison with Poisson distribution Blue bars denote a histogram of data divided into 1 sec bins. Red curve is a Poisson curve with rate = median count rate of data. |
 |
 |
| Quadrant-wise count rates Data is divided into 100 sec bins |
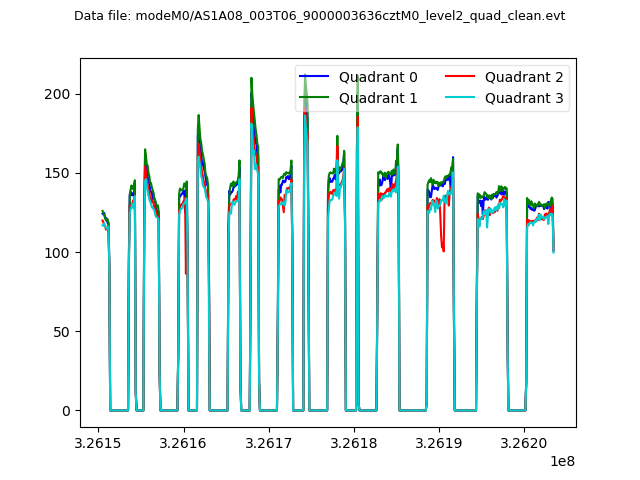 |
|
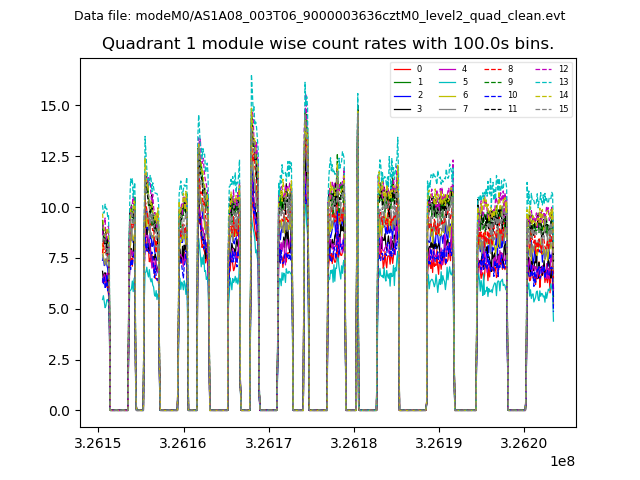
| Module-wise count rates for Quadrant A Data is divided into 100 sec bins |
 |
 |
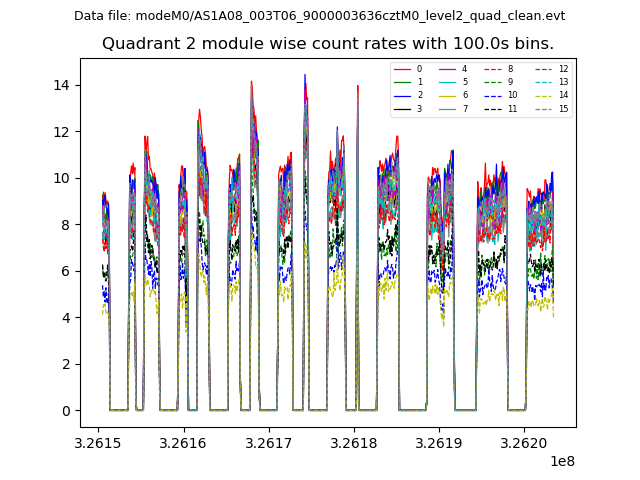
| Module-wise count rates for Quadrant B Data is divided into 100 sec bins |
 |
 |
| Module-wise count rates for Quadrant C Data is divided into 100 sec bins |
 |
 |
| Module-wise count rates for Quadrant D Data is divided into 100 sec bins |
 |
 |
| Parameter | Plot |
|---|---|
| CZT HV Monitor |  |
| D_VDD |  |
| Temperature 1 |  |
| Veto HV Monitor |  |
| Veto LLD |  |
| Alpha Counter |  |
| _CPM_Rate |  |
| CZT Counter | 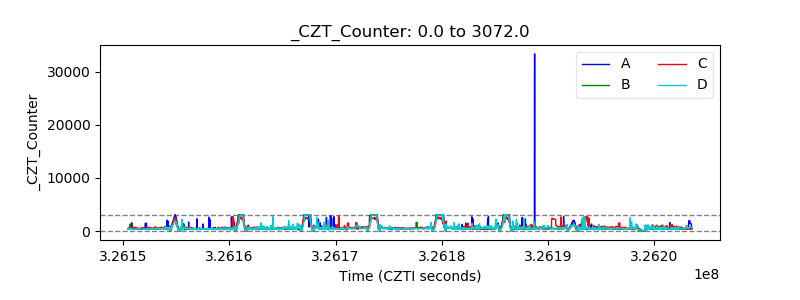 |
| +2.5 Volts monitor |  |
| +5 Volts monitor |  |
| _ROLL_ROT |  |
| _Roll_DEC | 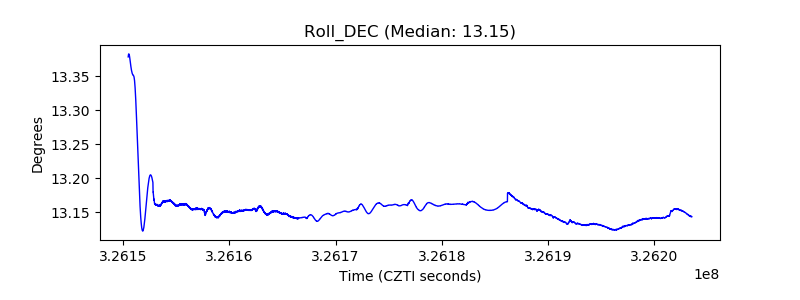 |
| _Roll_RA |  |
| Veto Counter |  |