| Param | Original file | Final file |
|---|---|---|
| Filename | modeM0/AS1A08_003T02_9000003630cztM0_level2_bc.evt | modeM0/AS1A08_003T02_9000003630cztM0_level2_quad_clean.evt |
| Size (bytes) | 910,920,960 | 325,045,440 |
| Size | 868.7 MB | 310.0 MB |
| Events in quadrant A | 5,366,095 | 2,050,763 |
| Events in quadrant B | 5,652,135 | 2,069,118 |
| Events in quadrant C | 5,244,676 | 1,962,955 |
| Events in quadrant D | 9,484,059 | 1,911,429 |
| Mode M0 | |||
|---|---|---|---|
| Quadrant | BADHDUFLAG | Total packets | Discarded packets |
| A | 0 | 55572 | 0 |
| B | 0 | 56686 | 0 |
| C | 0 | 55943 | 0 |
| D | 0 | 68017 | 0 |
| Mode M9 | |||
|---|---|---|---|
| Quadrant | BADHDUFLAG | Total packets | Discarded packets |
| A | 0 | 29 | 0 |
| B | 0 | 29 | 0 |
| C | 0 | 29 | 0 |
| D | 0 | 29 | 0 |
| Mode SS | |||
|---|---|---|---|
| Quadrant | BADHDUFLAG | Total packets | Discarded packets |
| A | 0 | 548 | 0 |
| B | 0 | 548 | 0 |
| C | 0 | 548 | 0 |
| D | 0 | 548 | 0 |
| Quadrant | Total seconds | Saturated seconds | Saturation percentage |
|---|---|---|---|
| A | 26912 | 357 | 1.326546% |
| B | 26912 | 458 | 1.701843% |
| C | 26912 | 581 | 2.158888% |
| D | 26912 | 942 | 3.500297% |
Noise dominated data is calculated using 1-second bins in cleaned event files. If a bin has >2000 counts, and if more than 50% of those come from <1% of pixels, then it is considered to be noise-dominated and hence unusable.
| Quadrant | # 1 sec bins | Bins with >0 counts | Bins with >2000 counts | High rate bins dominated by noise | Noise dominated (total time) | Noise dominated (detector-on time) | Marked lightcurve |
|---|---|---|---|---|---|---|---|
| A | 29737 | 26913 | 0 | 0 | 0.00% | 0.00% |  |
| B | 29737 | 26912 | 2 | 2 | 0.01% | 0.01% |  |
| C | 29737 | 26913 | 10 | 10 | 0.03% | 0.04% |  |
| D | 29737 | 26914 | 76 | 76 | 0.26% | 0.28% |  |
Top three noisy pixels from each quadrant. If the there are fewer than three noisy pixels in the level2.evt file, extra rows are filled as -1
| Pixel properties | Quadrant properties | ||||||
|---|---|---|---|---|---|---|---|
| Quadrant | DetID | PixID | Counts | Sigma | Mean | Median | Sigma |
| A | 13 | 254 | 37271 | 117.17 | 1386 | 1354 | 306.5 |
| A | 0 | 226 | 8757 | 24.15 | 1386 | 1354 | 306.5 |
| A | 12 | 194 | 8481 | 23.25 | 1386 | 1354 | 306.5 |
| B | 0 | 189 | 123879 | 456.11 | 1393 | 1356 | 268.6 |
| B | 10 | 251 | 79741 | 291.8 | 1393 | 1356 | 268.6 |
| B | 7 | 202 | 53149 | 192.81 | 1393 | 1356 | 268.6 |
| C | 2 | 16 | 97081 | 305.23 | 1325 | 1314 | 313.8 |
| C | 7 | 247 | 53345 | 165.83 | 1325 | 1314 | 313.8 |
| C | 13 | 61 | 7414 | 19.44 | 1325 | 1314 | 313.8 |
| D | 8 | 195 | 2090738 | 6590.19 | 1346 | 1294 | 317.1 |
| D | 5 | 222 | 1766320 | 5566.96 | 1346 | 1294 | 317.1 |
| D | 1 | 52 | 186340 | 583.64 | 1346 | 1294 | 317.1 |
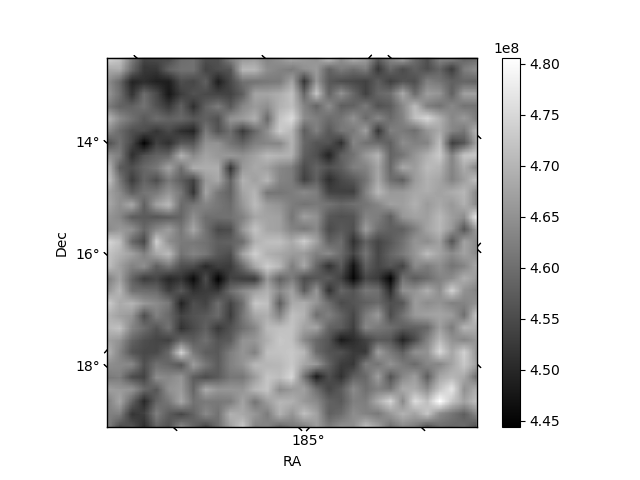
Histogram calculated using DETX and DETY for each event in the final _common_clean file
| Quadrant A |  |
 |
Quadrant B |
|---|---|---|---|
| Quadrant D |  |
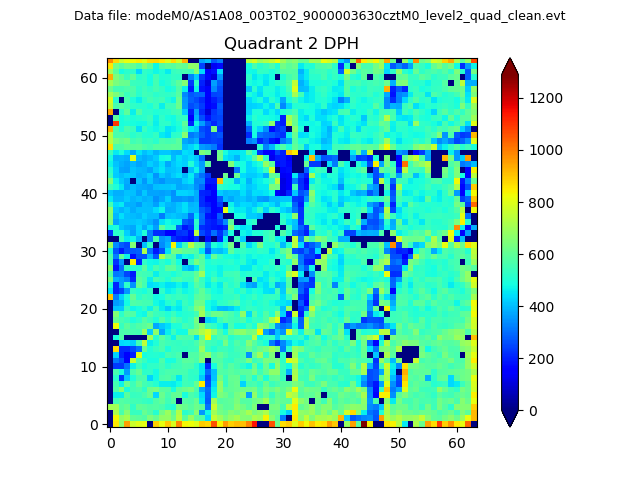 |
Quadrant C |
| Plot type | Count rate plots | Images |
|---|---|---|
| Comparison with Poisson distribution Blue bars denote a histogram of data divided into 1 sec bins. Red curve is a Poisson curve with rate = median count rate of data. |
 |
 |
| Quadrant-wise count rates Data is divided into 100 sec bins |
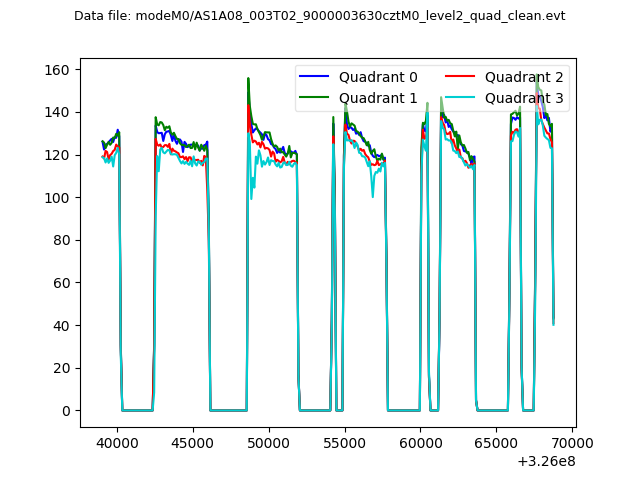 |
|
| Module-wise count rates for Quadrant A Data is divided into 100 sec bins |
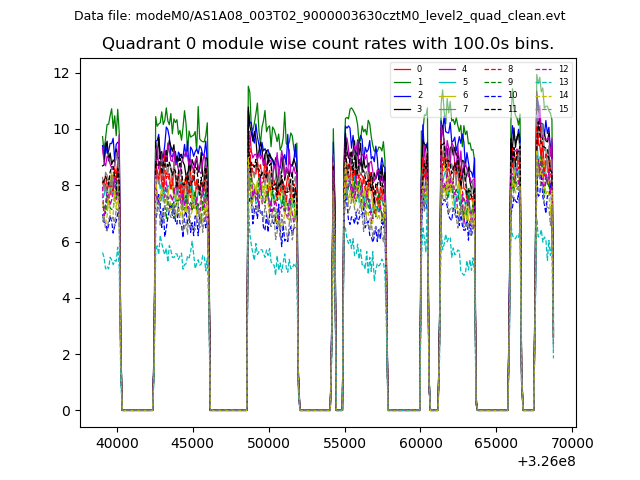 |
 |
| Module-wise count rates for Quadrant B Data is divided into 100 sec bins |
 |
 |
| Module-wise count rates for Quadrant C Data is divided into 100 sec bins |
 |
 |
| Module-wise count rates for Quadrant D Data is divided into 100 sec bins |
 |
 |
| Parameter | Plot |
|---|---|
| CZT HV Monitor |  |
| D_VDD | 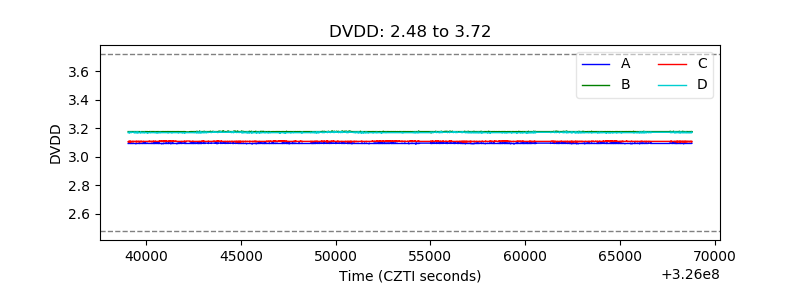 |
| Temperature 1 |  |
| Veto HV Monitor |  |
| Veto LLD |  |
| Alpha Counter |  |
| _CPM_Rate |  |
| CZT Counter | 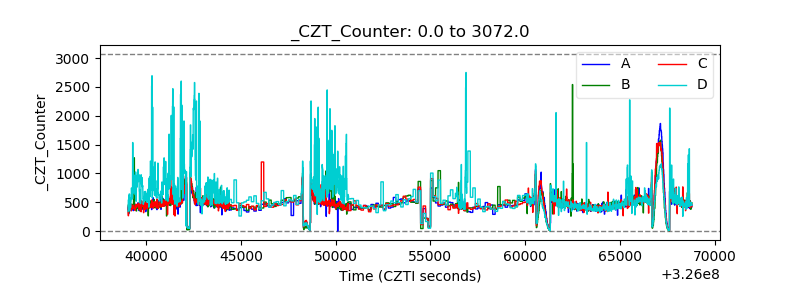 |
| +2.5 Volts monitor |  |
| +5 Volts monitor |  |
| _ROLL_ROT |  |
| _Roll_DEC |  |
| _Roll_RA | 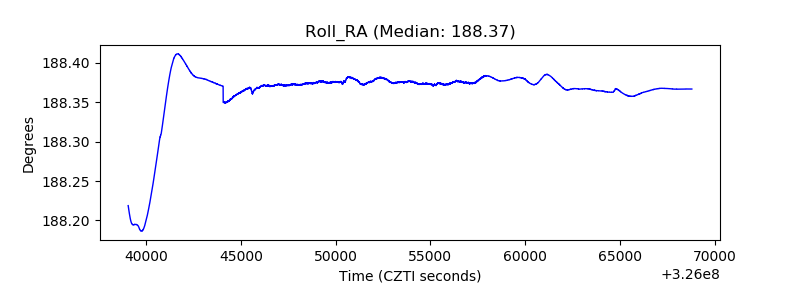 |
| Veto Counter |  |