| Param | Original file | Final file |
|---|---|---|
| Filename | modeM0/AS1A07_045T01_9000003628cztM0_level2_bc.evt | modeM0/AS1A07_045T01_9000003628cztM0_level2_quad_clean.evt |
| Size (bytes) | 1,885,394,880 | 669,312,000 |
| Size | 1.8 GB | 638.3 MB |
| Events in quadrant A | 11,594,360 | 4,282,535 |
| Events in quadrant B | 14,268,231 | 4,317,713 |
| Events in quadrant C | 12,788,662 | 4,051,194 |
| Events in quadrant D | 14,839,036 | 3,990,018 |
| Mode M9 | |||
|---|---|---|---|
| Quadrant | BADHDUFLAG | Total packets | Discarded packets |
| A | 0 | 103 | 0 |
| B | 0 | 103 | 0 |
| C | 0 | 103 | 0 |
| D | 0 | 103 | 0 |
| Mode M0 | |||
|---|---|---|---|
| Quadrant | BADHDUFLAG | Total packets | Discarded packets |
| A | 0 | 110459 | 0 |
| B | 0 | 121326 | 0 |
| C | 0 | 117605 | 0 |
| D | 0 | 119363 | 0 |
| Mode SS | |||
|---|---|---|---|
| Quadrant | BADHDUFLAG | Total packets | Discarded packets |
| A | 0 | 1076 | 0 |
| B | 0 | 1076 | 0 |
| C | 0 | 1076 | 0 |
| D | 0 | 1076 | 0 |
| Quadrant | Total seconds | Saturated seconds | Saturation percentage |
|---|---|---|---|
| A | 52941 | 562 | 1.061559% |
| B | 52941 | 1360 | 2.568897% |
| C | 52941 | 1111 | 2.098563% |
| D | 52940 | 488 | 0.921798% |
Noise dominated data is calculated using 1-second bins in cleaned event files. If a bin has >2000 counts, and if more than 50% of those come from <1% of pixels, then it is considered to be noise-dominated and hence unusable.
| Quadrant | # 1 sec bins | Bins with >0 counts | Bins with >2000 counts | High rate bins dominated by noise | Noise dominated (total time) | Noise dominated (detector-on time) | Marked lightcurve |
|---|---|---|---|---|---|---|---|
| A | 63086 | 52944 | 0 | 0 | 0.00% | 0.00% |  |
| B | 63086 | 52942 | 105 | 105 | 0.17% | 0.20% |  |
| C | 63086 | 52941 | 2 | 2 | 0.00% | 0.00% |  |
| D | 63086 | 52941 | 45 | 45 | 0.07% | 0.09% | 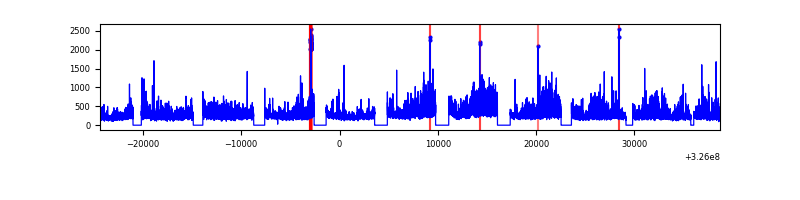 |
Top three noisy pixels from each quadrant. If the there are fewer than three noisy pixels in the level2.evt file, extra rows are filled as -1
| Pixel properties | Quadrant properties | ||||||
|---|---|---|---|---|---|---|---|
| Quadrant | DetID | PixID | Counts | Sigma | Mean | Median | Sigma |
| A | 13 | 254 | 71382 | 106.86 | 3002 | 2954 | 640.3 |
| A | 0 | 226 | 19068 | 25.17 | 3002 | 2954 | 640.3 |
| A | 12 | 194 | 18137 | 23.71 | 3002 | 2954 | 640.3 |
| B | 3 | 64 | 2366942 | 4242.92 | 3010 | 2940 | 557.2 |
| B | 0 | 189 | 155327 | 273.5 | 3010 | 2940 | 557.2 |
| B | 15 | 32 | 78329 | 135.31 | 3010 | 2940 | 557.2 |
| C | 7 | 247 | 1500289 | 2280.67 | 2835 | 2822 | 656.6 |
| C | 2 | 16 | 313528 | 473.21 | 2835 | 2822 | 656.6 |
| C | 5 | 112 | 72377 | 105.93 | 2835 | 2822 | 656.6 |
| D | 8 | 195 | 3163631 | 4755.49 | 2899 | 2797 | 664.7 |
| D | 1 | 52 | 327439 | 488.43 | 2899 | 2797 | 664.7 |
| D | 2 | 234 | 198852 | 294.97 | 2899 | 2797 | 664.7 |
Histogram calculated using DETX and DETY for each event in the final _common_clean file
| Quadrant A | 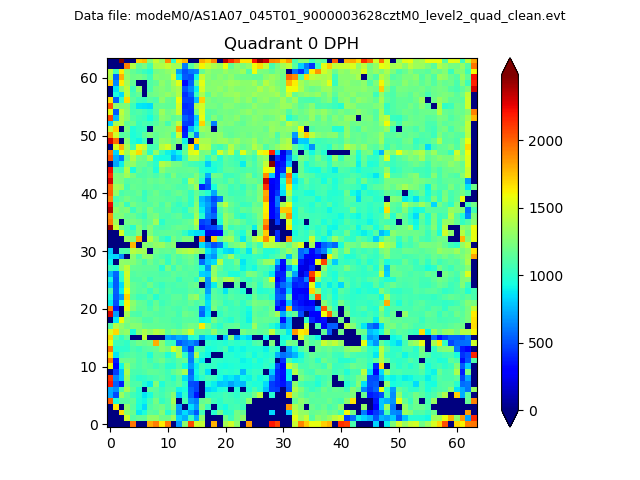 |
 |
Quadrant B |
|---|---|---|---|
| Quadrant D |  |
 |
Quadrant C |
| Plot type | Count rate plots | Images |
|---|---|---|
| Comparison with Poisson distribution Blue bars denote a histogram of data divided into 1 sec bins. Red curve is a Poisson curve with rate = median count rate of data. |
 |
 |
| Quadrant-wise count rates Data is divided into 100 sec bins |
 |
|
| Module-wise count rates for Quadrant A Data is divided into 100 sec bins |
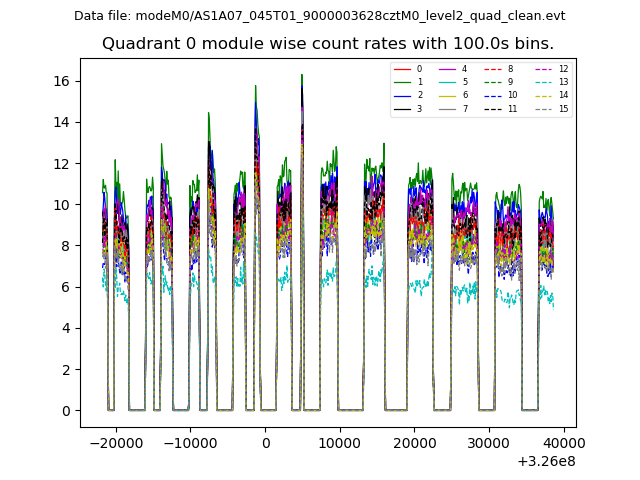 |
 |
| Module-wise count rates for Quadrant B Data is divided into 100 sec bins |
 |
 |
| Module-wise count rates for Quadrant C Data is divided into 100 sec bins |
 |
 |
| Module-wise count rates for Quadrant D Data is divided into 100 sec bins |
 |
 |
| Parameter | Plot |
|---|---|
| CZT HV Monitor |  |
| D_VDD |  |
| Temperature 1 |  |
| Veto HV Monitor | 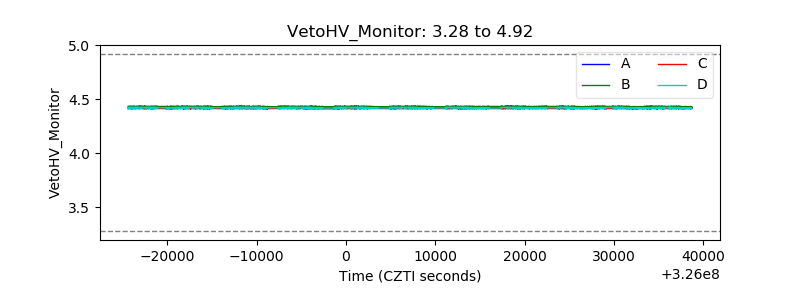 |
| Veto LLD |  |
| Alpha Counter |  |
| _CPM_Rate |  |
| CZT Counter | 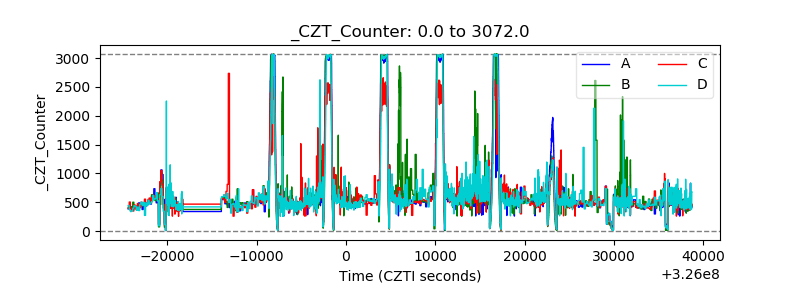 |
| +2.5 Volts monitor | 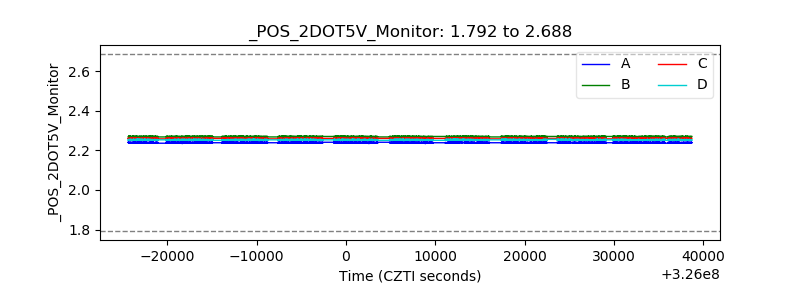 |
| +5 Volts monitor |  |
| _ROLL_ROT |  |
| _Roll_DEC |  |
| _Roll_RA |  |
| Veto Counter |  |