| Param | Original file | Final file |
|---|---|---|
| Filename | modeM0/AS1A07_147T01_9000003624cztM0_level2_bc.evt | modeM0/AS1A07_147T01_9000003624cztM0_level2_quad_clean.evt |
| Size (bytes) | 4,806,912,960 | 1,642,682,880 |
| Size | 4.5 GB | 1.5 GB |
| Events in quadrant A | 27,819,688 | 10,666,265 |
| Events in quadrant B | 41,993,870 | 10,271,321 |
| Events in quadrant C | 31,657,440 | 10,110,293 |
| Events in quadrant D | 35,386,055 | 9,933,777 |
| Mode M0 | |||
|---|---|---|---|
| Quadrant | BADHDUFLAG | Total packets | Discarded packets |
| A | 0 | 268288 | 0 |
| B | 0 | 327891 | 0 |
| C | 0 | 283788 | 0 |
| D | 0 | 290282 | 0 |
| Mode SS | |||
|---|---|---|---|
| Quadrant | BADHDUFLAG | Total packets | Discarded packets |
| A | 0 | 2610 | 0 |
| B | 0 | 2610 | 0 |
| C | 0 | 2610 | 0 |
| D | 0 | 2610 | 0 |
| Mode M9 | |||
|---|---|---|---|
| Quadrant | BADHDUFLAG | Total packets | Discarded packets |
| A | 0 | 220 | 0 |
| B | 0 | 220 | 0 |
| C | 0 | 220 | 0 |
| D | 0 | 220 | 0 |
| Quadrant | Total seconds | Saturated seconds | Saturation percentage |
|---|---|---|---|
| A | 128047 | 1559 | 1.217522% |
| B | 128046 | 10015 | 7.821408% |
| C | 128047 | 2950 | 2.303842% |
| D | 128047 | 2059 | 1.608003% |
Noise dominated data is calculated using 1-second bins in cleaned event files. If a bin has >2000 counts, and if more than 50% of those come from <1% of pixels, then it is considered to be noise-dominated and hence unusable.
| Quadrant | # 1 sec bins | Bins with >0 counts | Bins with >2000 counts | High rate bins dominated by noise | Noise dominated (total time) | Noise dominated (detector-on time) | Marked lightcurve |
|---|---|---|---|---|---|---|---|
| A | 149882 | 128050 | 0 | 0 | 0.00% | 0.00% |  |
| B | 149882 | 126598 | 763 | 763 | 0.51% | 0.60% |  |
| C | 149882 | 128055 | 26 | 26 | 0.02% | 0.02% |  |
| D | 149882 | 128052 | 149 | 149 | 0.10% | 0.12% |  |
Top three noisy pixels from each quadrant. If the there are fewer than three noisy pixels in the level2.evt file, extra rows are filled as -1
| Pixel properties | Quadrant properties | ||||||
|---|---|---|---|---|---|---|---|
| Quadrant | DetID | PixID | Counts | Sigma | Mean | Median | Sigma |
| A | 13 | 254 | 170257 | 106.53 | 7181 | 7061 | 1531.9 |
| A | 12 | 96 | 56468 | 32.25 | 7181 | 7061 | 1531.9 |
| A | 4 | 2 | 49080 | 27.43 | 7181 | 7061 | 1531.9 |
| B | 3 | 64 | 14305306 | 11119.18 | 6915 | 6757 | 1285.9 |
| B | 10 | 246 | 502435 | 385.46 | 6915 | 6757 | 1285.9 |
| B | 0 | 189 | 237803 | 179.67 | 6915 | 6757 | 1285.9 |
| C | 7 | 247 | 4251112 | 2693.7 | 6797 | 6769 | 1575.7 |
| C | 10 | 91 | 583613 | 366.1 | 6797 | 6769 | 1575.7 |
| C | 2 | 16 | 476201 | 297.93 | 6797 | 6769 | 1575.7 |
| D | 8 | 195 | 4361676 | 2746.57 | 6948 | 6709 | 1585.6 |
| D | 1 | 52 | 2514313 | 1581.48 | 6948 | 6709 | 1585.6 |
| D | 12 | 233 | 1361247 | 854.27 | 6948 | 6709 | 1585.6 |
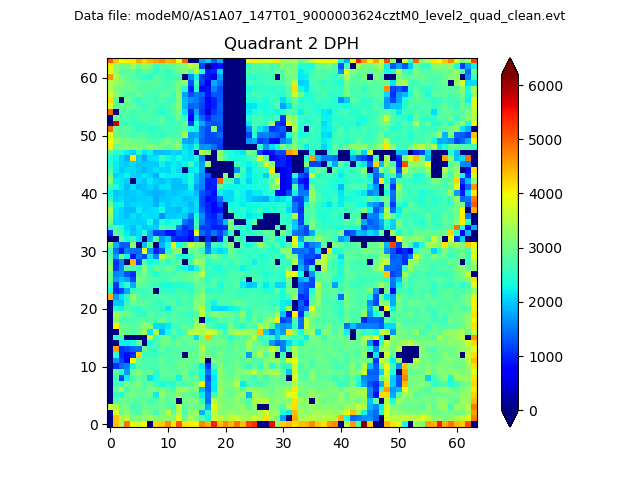
Histogram calculated using DETX and DETY for each event in the final _common_clean file
| Quadrant A | 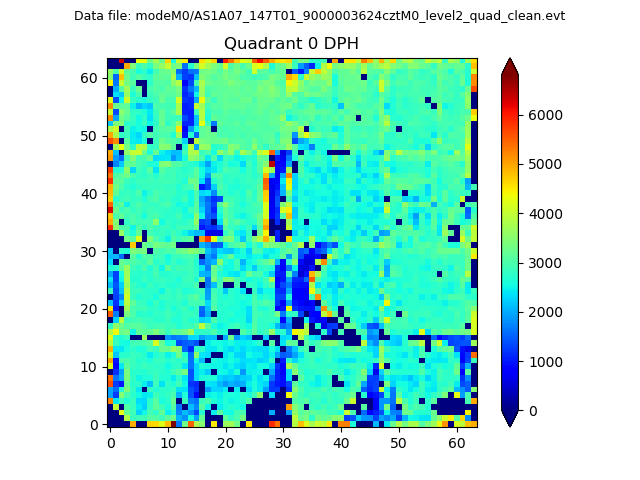 |
 |
Quadrant B |
|---|---|---|---|
| Quadrant D |  |
 |
Quadrant C |
| Plot type | Count rate plots | Images |
|---|---|---|
| Comparison with Poisson distribution Blue bars denote a histogram of data divided into 1 sec bins. Red curve is a Poisson curve with rate = median count rate of data. |
 |
 |
| Quadrant-wise count rates Data is divided into 100 sec bins |
 |
|
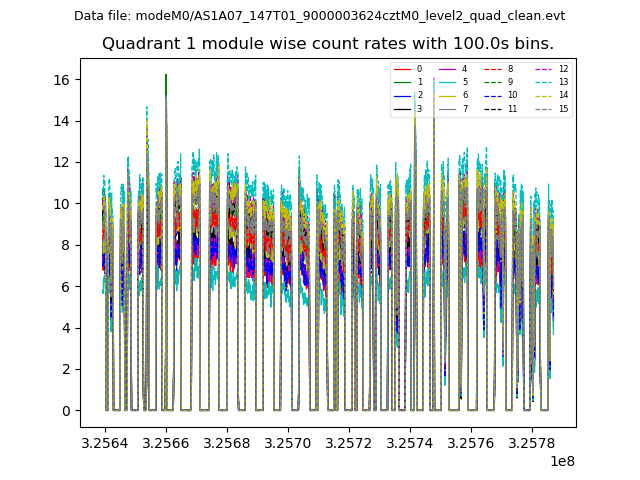
| Module-wise count rates for Quadrant A Data is divided into 100 sec bins |
 |
 |
| Module-wise count rates for Quadrant B Data is divided into 100 sec bins |
 |
 |
| Module-wise count rates for Quadrant C Data is divided into 100 sec bins |
 |
 |
| Module-wise count rates for Quadrant D Data is divided into 100 sec bins |
 |
 |
| Parameter | Plot |
|---|---|
| CZT HV Monitor |  |
| D_VDD |  |
| Temperature 1 | 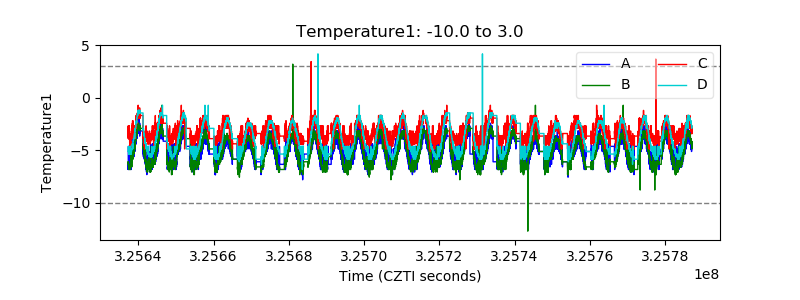 |
| Veto HV Monitor | 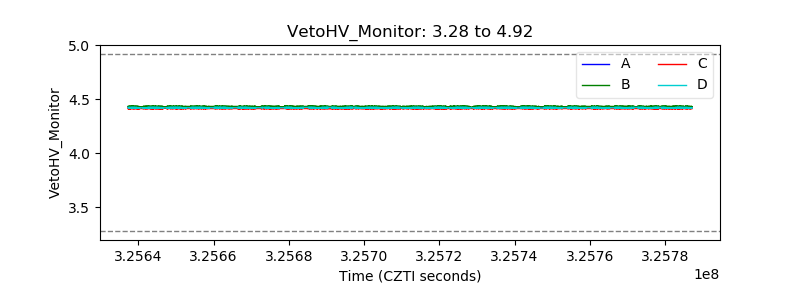 |
| Veto LLD | 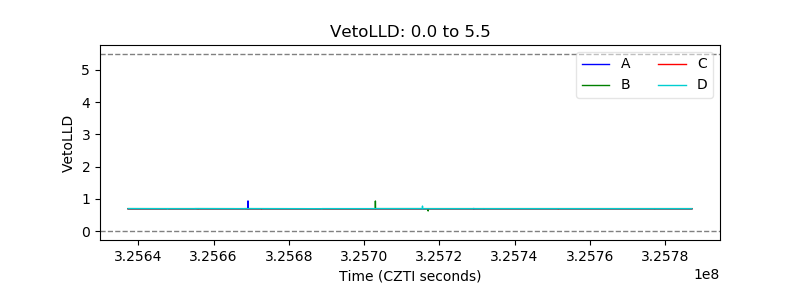 |
| Alpha Counter |  |
| _CPM_Rate |  |
| CZT Counter |  |
| +2.5 Volts monitor |  |
| +5 Volts monitor |  |
| _ROLL_ROT |  |
| _Roll_DEC |  |
| _Roll_RA | 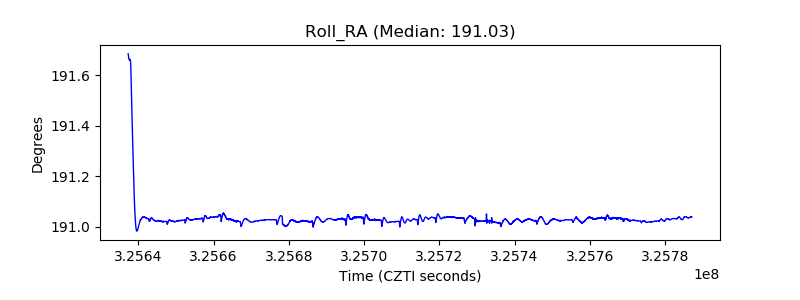 |
| Veto Counter |  |