| Param | Original file | Final file |
|---|---|---|
| Filename | modeM0/AS1T03_194T01_9000003620cztM0_level2_bc.evt | modeM0/AS1T03_194T01_9000003620cztM0_level2_quad_clean.evt |
| Size (bytes) | 6,607,892,160 | 2,065,328,640 |
| Size | 6.2 GB | 1.9 GB |
| Events in quadrant A | 34,352,263 | 13,620,153 |
| Events in quadrant B | 36,668,300 | 13,625,339 |
| Events in quadrant C | 69,519,374 | 12,728,664 |
| Events in quadrant D | 49,773,131 | 12,693,320 |
| Mode M9 | |||
|---|---|---|---|
| Quadrant | BADHDUFLAG | Total packets | Discarded packets |
| A | 0 | 261 | 0 |
| B | 0 | 263 | 0 |
| C | 0 | 263 | 0 |
| D | 0 | 263 | 0 |
| Mode M0 | |||
|---|---|---|---|
| Quadrant | BADHDUFLAG | Total packets | Discarded packets |
| A | 0 | 327420 | 0 |
| B | 0 | 336662 | 0 |
| C | 0 | 453389 | 0 |
| D | 0 | 375797 | 0 |
| Mode SS | |||
|---|---|---|---|
| Quadrant | BADHDUFLAG | Total packets | Discarded packets |
| A | 0 | 1568 | 0 |
| B | 0 | 1568 | 0 |
| C | 0 | 1568 | 0 |
| D | 0 | 1568 | 0 |
| Quadrant | Total seconds | Saturated seconds | Saturation percentage |
|---|---|---|---|
| A | 154443 | 1929 | 1.249004% |
| B | 154443 | 2551 | 1.651742% |
| C | 154442 | 5132 | 3.322930% |
| D | 154442 | 3966 | 2.567954% |
Noise dominated data is calculated using 1-second bins in cleaned event files. If a bin has >2000 counts, and if more than 50% of those come from <1% of pixels, then it is considered to be noise-dominated and hence unusable.
| Quadrant | # 1 sec bins | Bins with >0 counts | Bins with >2000 counts | High rate bins dominated by noise | Noise dominated (total time) | Noise dominated (detector-on time) | Marked lightcurve |
|---|---|---|---|---|---|---|---|
| A | 184078 | 154421 | 71 | 71 | 0.04% | 0.05% |  |
| B | 184077 | 154419 | 57 | 57 | 0.03% | 0.04% |  |
| C | 184078 | 154418 | 96 | 96 | 0.05% | 0.06% |  |
| D | 184078 | 154421 | 567 | 567 | 0.31% | 0.37% |  |
Top three noisy pixels from each quadrant. If the there are fewer than three noisy pixels in the level2.evt file, extra rows are filled as -1
| Pixel properties | Quadrant properties | ||||||
|---|---|---|---|---|---|---|---|
| Quadrant | DetID | PixID | Counts | Sigma | Mean | Median | Sigma |
| A | 3 | 1 | 751590 | 405.23 | 8645 | 8507 | 1833.7 |
| A | 13 | 254 | 217632 | 114.04 | 8645 | 8507 | 1833.7 |
| A | 10 | 255 | 124339 | 63.17 | 8645 | 8507 | 1833.7 |
| B | 3 | 64 | 861691 | 532.26 | 8633 | 8438 | 1603.1 |
| B | 0 | 230 | 846882 | 523.03 | 8633 | 8438 | 1603.1 |
| B | 0 | 189 | 573380 | 352.41 | 8633 | 8438 | 1603.1 |
| C | 7 | 247 | 35418521 | 18688.39 | 8131 | 8110 | 1894.8 |
| C | 2 | 16 | 1227187 | 643.39 | 8131 | 8110 | 1894.8 |
| C | 10 | 91 | 942310 | 493.04 | 8131 | 8110 | 1894.8 |
| D | 1 | 52 | 10216783 | 5298.94 | 8405 | 8125 | 1926.5 |
| D | 8 | 195 | 3104639 | 1607.29 | 8405 | 8125 | 1926.5 |
| D | 12 | 233 | 1697052 | 876.66 | 8405 | 8125 | 1926.5 |
Histogram calculated using DETX and DETY for each event in the final _common_clean file
| Quadrant A |  |
 |
Quadrant B |
|---|---|---|---|
| Quadrant D |  |
 |
Quadrant C |
| Plot type | Count rate plots | Images |
|---|---|---|
| Comparison with Poisson distribution Blue bars denote a histogram of data divided into 1 sec bins. Red curve is a Poisson curve with rate = median count rate of data. |
 |
 |
| Quadrant-wise count rates Data is divided into 100 sec bins |
 |
|
| Module-wise count rates for Quadrant A Data is divided into 100 sec bins |
 |
 |
| Module-wise count rates for Quadrant B Data is divided into 100 sec bins |
 |
 |
| Module-wise count rates for Quadrant C Data is divided into 100 sec bins |
 |
 |
| Module-wise count rates for Quadrant D Data is divided into 100 sec bins |
 |
 |
| Parameter | Plot |
|---|---|
| CZT HV Monitor |  |
| D_VDD |  |
| Temperature 1 |  |
| Veto HV Monitor |  |
| Veto LLD |  |
| Alpha Counter |  |
| _CPM_Rate |  |
| CZT Counter |  |
| +2.5 Volts monitor |  |
| +5 Volts monitor | 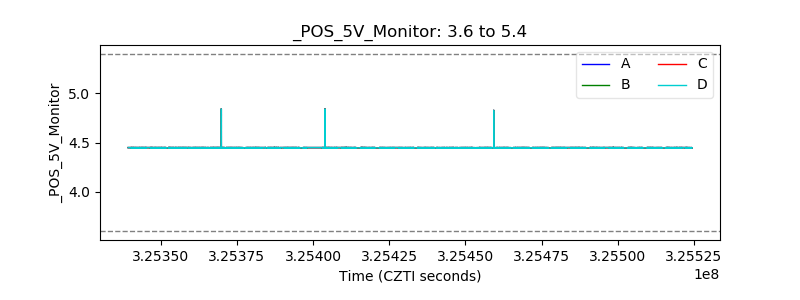 |
| _ROLL_ROT |  |
| _Roll_DEC |  |
| _Roll_RA |  |
| Veto Counter |  |