| Param | Original file | Final file |
|---|---|---|
| Filename | modeM0/AS1T03_191T01_9000003618cztM0_level2_bc.evt | modeM0/AS1T03_191T01_9000003618cztM0_level2_quad_clean.evt |
| Size (bytes) | 12,488,293,440 | 6,026,878,080 |
| Size | 11.6 GB | 5.6 GB |
| Events in quadrant A | 66,050,473 | 42,120,361 |
| Events in quadrant B | 71,278,851 | 42,153,186 |
| Events in quadrant C | 78,779,568 | 39,902,184 |
| Events in quadrant D | 142,771,000 | 38,914,878 |
| Mode M9 | |||
|---|---|---|---|
| Quadrant | BADHDUFLAG | Total packets | Discarded packets |
| A | 0 | 497 | 0 |
| B | 0 | 497 | 0 |
| C | 0 | 497 | 0 |
| D | 0 | 497 | 0 |
| Mode M0 | |||
|---|---|---|---|
| Quadrant | BADHDUFLAG | Total packets | Discarded packets |
| A | 0 | 633984 | 0 |
| B | 0 | 651222 | 0 |
| C | 0 | 681255 | 0 |
| D | 0 | 876487 | 0 |
| Mode SS | |||
|---|---|---|---|
| Quadrant | BADHDUFLAG | Total packets | Discarded packets |
| A | 0 | 3099 | 0 |
| B | 0 | 3099 | 0 |
| C | 0 | 3099 | 0 |
| D | 0 | 3099 | 0 |
| Quadrant | Total seconds | Saturated seconds | Saturation percentage |
|---|---|---|---|
| A | 304325 | 2754 | 0.904954% |
| B | 304325 | 4053 | 1.331800% |
| C | 304325 | 5344 | 1.756017% |
| D | 304325 | 15734 | 5.170131% |
Noise dominated data is calculated using 1-second bins in cleaned event files. If a bin has >2000 counts, and if more than 50% of those come from <1% of pixels, then it is considered to be noise-dominated and hence unusable.
| Quadrant | # 1 sec bins | Bins with >0 counts | Bins with >2000 counts | High rate bins dominated by noise | Noise dominated (total time) | Noise dominated (detector-on time) | Marked lightcurve |
|---|---|---|---|---|---|---|---|
| A | 353775 | 304297 | 25 | 25 | 0.01% | 0.01% | 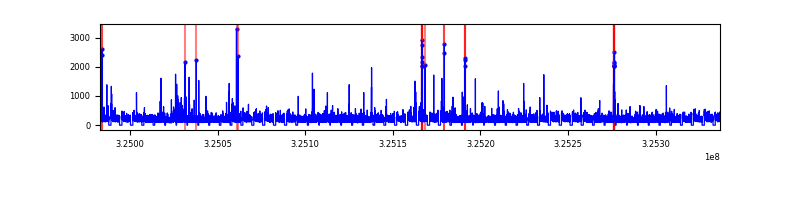 |
| B | 353775 | 304298 | 310 | 310 | 0.09% | 0.10% |  |
| C | 353775 | 304291 | 120 | 120 | 0.03% | 0.04% |  |
| D | 353775 | 304294 | 6028 | 6028 | 1.70% | 1.98% |  |
Top three noisy pixels from each quadrant. If the there are fewer than three noisy pixels in the level2.evt file, extra rows are filled as -1
| Pixel properties | Quadrant properties | ||||||
|---|---|---|---|---|---|---|---|
| Quadrant | DetID | PixID | Counts | Sigma | Mean | Median | Sigma |
| A | 13 | 254 | 481027 | 127.73 | 16913 | 16691 | 3635.2 |
| A | 12 | 96 | 295414 | 76.67 | 16913 | 16691 | 3635.2 |
| A | 4 | 2 | 215187 | 54.6 | 16913 | 16691 | 3635.2 |
| B | 4 | 80 | 2747806 | 862.09 | 16833 | 16504 | 3168.2 |
| B | 0 | 189 | 1134856 | 352.99 | 16833 | 16504 | 3168.2 |
| B | 0 | 190 | 770510 | 237.99 | 16833 | 16504 | 3168.2 |
| C | 7 | 247 | 14049730 | 3720.15 | 15970 | 15945 | 3772.4 |
| C | 10 | 91 | 891720 | 232.16 | 15970 | 15945 | 3772.4 |
| C | 2 | 16 | 751173 | 194.9 | 15970 | 15945 | 3772.4 |
| D | 1 | 52 | 53124016 | 13766.62 | 16325 | 15785 | 3857.8 |
| D | 8 | 195 | 18525800 | 4798.13 | 16325 | 15785 | 3857.8 |
| D | 7 | 238 | 4926367 | 1272.91 | 16325 | 15785 | 3857.8 |
Histogram calculated using DETX and DETY for each event in the final _common_clean file
| Quadrant A |  |
 |
Quadrant B |
|---|---|---|---|
| Quadrant D |  |
 |
Quadrant C |
| Plot type | Count rate plots | Images |
|---|---|---|
| Comparison with Poisson distribution Blue bars denote a histogram of data divided into 1 sec bins. Red curve is a Poisson curve with rate = median count rate of data. |
 |
 |
| Quadrant-wise count rates Data is divided into 100 sec bins |
 |
|
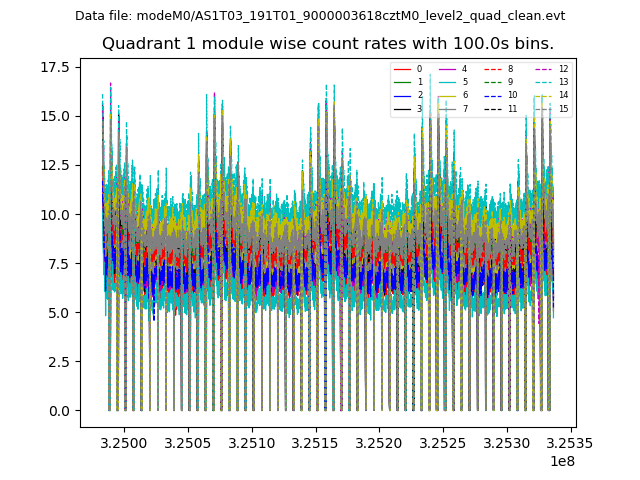
| Module-wise count rates for Quadrant A Data is divided into 100 sec bins |
 |
 |
| Module-wise count rates for Quadrant B Data is divided into 100 sec bins |
 |
 |
| Module-wise count rates for Quadrant C Data is divided into 100 sec bins |
 |
 |
| Module-wise count rates for Quadrant D Data is divided into 100 sec bins |
 |
 |
| Parameter | Plot |
|---|---|
| CZT HV Monitor |  |
| D_VDD |  |
| Temperature 1 |  |
| Veto HV Monitor |  |
| Veto LLD |  |
| Alpha Counter |  |
| _CPM_Rate |  |
| CZT Counter |  |
| +2.5 Volts monitor |  |
| +5 Volts monitor |  |
| _ROLL_ROT |  |
| _Roll_DEC |  |
| _Roll_RA |  |
| Veto Counter | 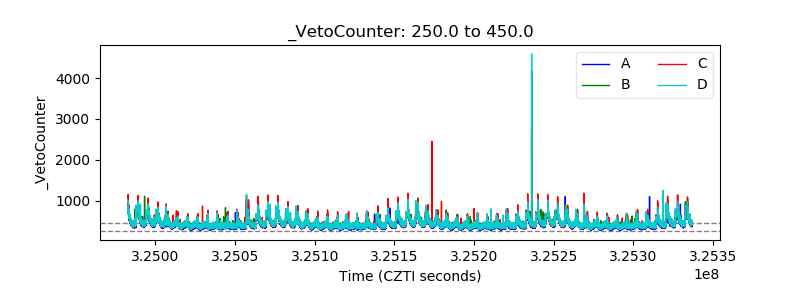 |