| Param | Original file | Final file |
|---|---|---|
| Filename | modeM0/AS1T03_189T01_9000003614cztM0_level2_bc.evt | modeM0/AS1T03_189T01_9000003614cztM0_level2_quad_clean.evt |
| Size (bytes) | 7,835,587,200 | 2,550,153,600 |
| Size | 7.3 GB | 2.4 GB |
| Events in quadrant A | 39,372,513 | 16,711,592 |
| Events in quadrant B | 49,104,971 | 16,665,108 |
| Events in quadrant C | 79,322,988 | 15,708,840 |
| Events in quadrant D | 57,170,008 | 15,737,024 |
| Mode M9 | |||
|---|---|---|---|
| Quadrant | BADHDUFLAG | Total packets | Discarded packets |
| A | 0 | 272 | 0 |
| B | 0 | 273 | 0 |
| C | 0 | 273 | 0 |
| D | 0 | 273 | 0 |
| Mode M0 | |||
|---|---|---|---|
| Quadrant | BADHDUFLAG | Total packets | Discarded packets |
| A | 0 | 382096 | 0 |
| B | 0 | 419449 | 0 |
| C | 0 | 512406 | 0 |
| D | 0 | 437137 | 0 |
| Mode SS | |||
|---|---|---|---|
| Quadrant | BADHDUFLAG | Total packets | Discarded packets |
| A | 0 | 3700 | 0 |
| B | 0 | 3700 | 0 |
| C | 0 | 3700 | 0 |
| D | 0 | 3700 | 0 |
| Quadrant | Total seconds | Saturated seconds | Saturation percentage |
|---|---|---|---|
| A | 181297 | 2027 | 1.118055% |
| B | 181298 | 5852 | 3.227835% |
| C | 181298 | 15226 | 8.398328% |
| D | 181296 | 4558 | 2.514121% |
Noise dominated data is calculated using 1-second bins in cleaned event files. If a bin has >2000 counts, and if more than 50% of those come from <1% of pixels, then it is considered to be noise-dominated and hence unusable.
| Quadrant | # 1 sec bins | Bins with >0 counts | Bins with >2000 counts | High rate bins dominated by noise | Noise dominated (total time) | Noise dominated (detector-on time) | Marked lightcurve |
|---|---|---|---|---|---|---|---|
| A | 207773 | 181294 | 5 | 5 | 0.00% | 0.00% |  |
| B | 207773 | 181283 | 500 | 500 | 0.24% | 0.28% |  |
| C | 207773 | 181293 | 3553 | 3553 | 1.71% | 1.96% |  |
| D | 207773 | 181289 | 968 | 968 | 0.47% | 0.53% |  |
Top three noisy pixels from each quadrant. If the there are fewer than three noisy pixels in the level2.evt file, extra rows are filled as -1
| Pixel properties | Quadrant properties | ||||||
|---|---|---|---|---|---|---|---|
| Quadrant | DetID | PixID | Counts | Sigma | Mean | Median | Sigma |
| A | 13 | 254 | 251446 | 112.59 | 10102 | 9949 | 2144.9 |
| A | 12 | 96 | 245008 | 109.59 | 10102 | 9949 | 2144.9 |
| A | 6 | 16 | 151719 | 66.1 | 10102 | 9949 | 2144.9 |
| B | 3 | 64 | 9731973 | 5212.34 | 10056 | 9834 | 1865.2 |
| B | 7 | 202 | 416568 | 218.06 | 10056 | 9834 | 1865.2 |
| B | 0 | 190 | 159948 | 80.48 | 10056 | 9834 | 1865.2 |
| C | 7 | 247 | 40962248 | 18427.47 | 9528 | 9511 | 2222.4 |
| C | 9 | 54 | 655471 | 290.66 | 9528 | 9511 | 2222.4 |
| C | 3 | 233 | 312778 | 136.46 | 9528 | 9511 | 2222.4 |
| D | 1 | 52 | 8975488 | 3977.76 | 9865 | 9544 | 2254.0 |
| D | 8 | 195 | 5289586 | 2342.5 | 9865 | 9544 | 2254.0 |
| D | 13 | 104 | 2304173 | 1018.02 | 9865 | 9544 | 2254.0 |
Histogram calculated using DETX and DETY for each event in the final _common_clean file
| Quadrant A |  |
 |
Quadrant B |
|---|---|---|---|
| Quadrant D |  |
 |
Quadrant C |
| Plot type | Count rate plots | Images |
|---|---|---|
| Comparison with Poisson distribution Blue bars denote a histogram of data divided into 1 sec bins. Red curve is a Poisson curve with rate = median count rate of data. |
 |
 |
| Quadrant-wise count rates Data is divided into 100 sec bins |
 |
|
| Module-wise count rates for Quadrant A Data is divided into 100 sec bins |
 |
 |
| Module-wise count rates for Quadrant B Data is divided into 100 sec bins |
 |
 |
| Module-wise count rates for Quadrant C Data is divided into 100 sec bins |
 |
 |
| Module-wise count rates for Quadrant D Data is divided into 100 sec bins |
 |
 |
| Parameter | Plot |
|---|---|
| CZT HV Monitor |  |
| D_VDD |  |
| Temperature 1 | 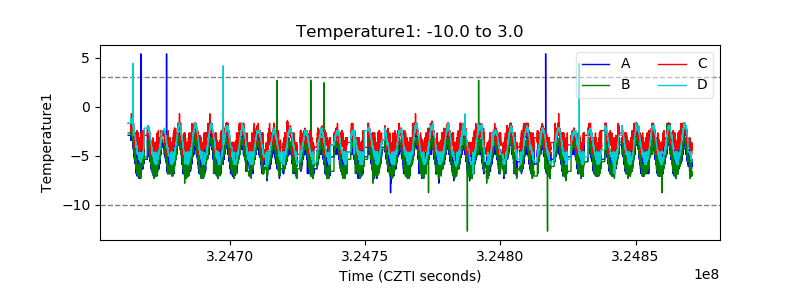 |
| Veto HV Monitor |  |
| Veto LLD |  |
| Alpha Counter |  |
| _CPM_Rate |  |
| CZT Counter |  |
| +2.5 Volts monitor | 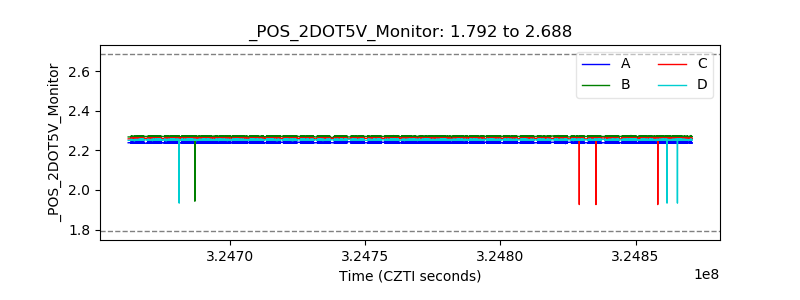 |
| +5 Volts monitor |  |
| _ROLL_ROT |  |
| _Roll_DEC |  |
| _Roll_RA |  |
| Veto Counter |  |