| Param | Original file | Final file |
|---|---|---|
| Filename | modeM0/AS1T03_188T01_9000003612cztM0_level2_bc.evt | modeM0/AS1T03_188T01_9000003612cztM0_level2_quad_clean.evt |
| Size (bytes) | 2,197,684,800 | 559,756,800 |
| Size | 2.0 GB | 533.8 MB |
| Events in quadrant A | 9,222,248 | 3,679,664 |
| Events in quadrant B | 11,793,431 | 3,697,737 |
| Events in quadrant C | 20,278,052 | 3,381,802 |
| Events in quadrant D | 22,473,752 | 3,378,583 |
| Mode M0 | |||
|---|---|---|---|
| Quadrant | BADHDUFLAG | Total packets | Discarded packets |
| A | 0 | 86720 | 0 |
| B | 0 | 97327 | 0 |
| C | 0 | 122571 | 0 |
| D | 0 | 127438 | 0 |
| Mode M9 | |||
|---|---|---|---|
| Quadrant | BADHDUFLAG | Total packets | Discarded packets |
| A | 0 | 74 | 0 |
| B | 0 | 74 | 0 |
| C | 0 | 74 | 0 |
| D | 0 | 74 | 0 |
| Mode SS | |||
|---|---|---|---|
| Quadrant | BADHDUFLAG | Total packets | Discarded packets |
| A | 0 | 836 | 0 |
| B | 0 | 836 | 0 |
| C | 0 | 836 | 0 |
| D | 0 | 836 | 0 |
| Quadrant | Total seconds | Saturated seconds | Saturation percentage |
|---|---|---|---|
| A | 41012 | 412 | 1.004584% |
| B | 41012 | 1440 | 3.511167% |
| C | 41012 | 4488 | 10.943139% |
| D | 41012 | 1446 | 3.525797% |
Noise dominated data is calculated using 1-second bins in cleaned event files. If a bin has >2000 counts, and if more than 50% of those come from <1% of pixels, then it is considered to be noise-dominated and hence unusable.
| Quadrant | # 1 sec bins | Bins with >0 counts | Bins with >2000 counts | High rate bins dominated by noise | Noise dominated (total time) | Noise dominated (detector-on time) | Marked lightcurve |
|---|---|---|---|---|---|---|---|
| A | 48412 | 41013 | 2 | 2 | 0.00% | 0.00% |  |
| B | 48412 | 41008 | 58 | 58 | 0.12% | 0.14% |  |
| C | 48412 | 41012 | 1637 | 1637 | 3.38% | 3.99% | 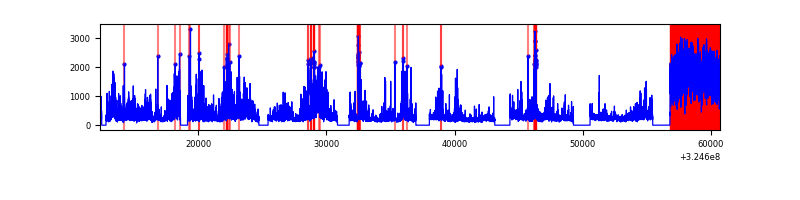 |
| D | 48412 | 41012 | 448 | 448 | 0.93% | 1.09% |  |
Top three noisy pixels from each quadrant. If the there are fewer than three noisy pixels in the level2.evt file, extra rows are filled as -1
| Pixel properties | Quadrant properties | ||||||
|---|---|---|---|---|---|---|---|
| Quadrant | DetID | PixID | Counts | Sigma | Mean | Median | Sigma |
| A | 13 | 254 | 63193 | 120.72 | 2366 | 2334 | 504.1 |
| A | 10 | 255 | 57165 | 108.77 | 2366 | 2334 | 504.1 |
| A | 6 | 16 | 46070 | 86.76 | 2366 | 2334 | 504.1 |
| B | 3 | 64 | 2546626 | 5811.35 | 2361 | 2319 | 437.8 |
| B | 0 | 190 | 79589 | 176.49 | 2361 | 2319 | 437.8 |
| B | 7 | 202 | 54106 | 118.28 | 2361 | 2319 | 437.8 |
| C | 7 | 247 | 11235670 | 21987.45 | 2169 | 2167 | 510.9 |
| C | 2 | 16 | 593271 | 1156.97 | 2169 | 2167 | 510.9 |
| C | 3 | 233 | 53874 | 101.21 | 2169 | 2167 | 510.9 |
| D | 8 | 195 | 10518954 | 19895.46 | 2276 | 2210 | 528.6 |
| D | 1 | 52 | 1459888 | 2757.62 | 2276 | 2210 | 528.6 |
| D | 1 | 255 | 1368615 | 2584.95 | 2276 | 2210 | 528.6 |
Histogram calculated using DETX and DETY for each event in the final _common_clean file
| Quadrant A |  |
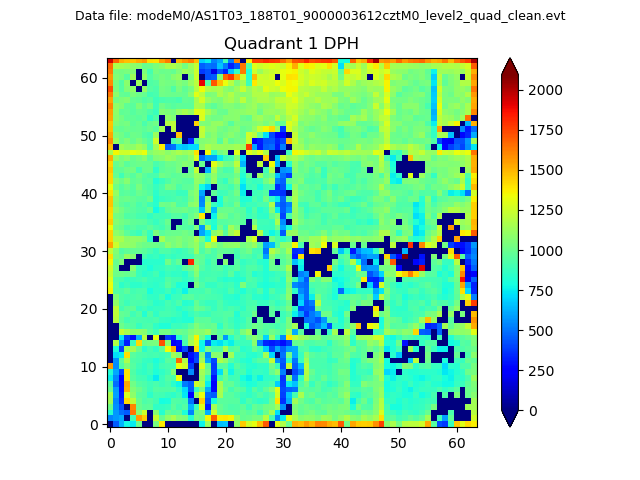 |
Quadrant B |
|---|---|---|---|
| Quadrant D |  |
 |
Quadrant C |
| Plot type | Count rate plots | Images |
|---|---|---|
| Comparison with Poisson distribution Blue bars denote a histogram of data divided into 1 sec bins. Red curve is a Poisson curve with rate = median count rate of data. |
 |
 |
| Quadrant-wise count rates Data is divided into 100 sec bins |
 |
|
| Module-wise count rates for Quadrant A Data is divided into 100 sec bins |
 |
 |
| Module-wise count rates for Quadrant B Data is divided into 100 sec bins |
 |
 |
| Module-wise count rates for Quadrant C Data is divided into 100 sec bins |
 |
 |
| Module-wise count rates for Quadrant D Data is divided into 100 sec bins |
 |
 |
| Parameter | Plot |
|---|---|
| CZT HV Monitor |  |
| D_VDD |  |
| Temperature 1 |  |
| Veto HV Monitor |  |
| Veto LLD |  |
| Alpha Counter |  |
| _CPM_Rate |  |
| CZT Counter |  |
| +2.5 Volts monitor |  |
| +5 Volts monitor |  |
| _ROLL_ROT |  |
| _Roll_DEC |  |
| _Roll_RA |  |
| Veto Counter |  |