| Param | Original file | Final file |
|---|---|---|
| Filename | modeM0/AS1T03_183T01_9000003610cztM0_level2_bc.evt | modeM0/AS1T03_183T01_9000003610cztM0_level2_quad_clean.evt |
| Size (bytes) | 6,593,676,480 | 2,208,320,640 |
| Size | 6.1 GB | 2.1 GB |
| Events in quadrant A | 28,196,858 | 15,345,297 |
| Events in quadrant B | 29,050,658 | 15,459,439 |
| Events in quadrant C | 71,889,903 | 13,782,634 |
| Events in quadrant D | 62,266,144 | 13,939,689 |
| Mode M0 | |||
|---|---|---|---|
| Quadrant | BADHDUFLAG | Total packets | Discarded packets |
| A | 0 | 259547 | 0 |
| B | 0 | 264330 | 0 |
| C | 0 | 397047 | 0 |
| D | 0 | 365216 | 0 |
| Mode SS | |||
|---|---|---|---|
| Quadrant | BADHDUFLAG | Total packets | Discarded packets |
| A | 0 | 2486 | 0 |
| B | 0 | 2486 | 0 |
| C | 0 | 2486 | 0 |
| D | 0 | 2486 | 0 |
| Mode M9 | |||
|---|---|---|---|
| Quadrant | BADHDUFLAG | Total packets | Discarded packets |
| A | 0 | 199 | 0 |
| B | 0 | 199 | 0 |
| C | 0 | 199 | 0 |
| D | 0 | 199 | 0 |
| Quadrant | Total seconds | Saturated seconds | Saturation percentage |
|---|---|---|---|
| A | 122041 | 1582 | 1.296286% |
| B | 122041 | 2260 | 1.851837% |
| C | 122041 | 18269 | 14.969559% |
| D | 122041 | 4564 | 3.739727% |
Noise dominated data is calculated using 1-second bins in cleaned event files. If a bin has >2000 counts, and if more than 50% of those come from <1% of pixels, then it is considered to be noise-dominated and hence unusable.
| Quadrant | # 1 sec bins | Bins with >0 counts | Bins with >2000 counts | High rate bins dominated by noise | Noise dominated (total time) | Noise dominated (detector-on time) | Marked lightcurve |
|---|---|---|---|---|---|---|---|
| A | 141792 | 122040 | 149 | 149 | 0.11% | 0.12% |  |
| B | 141792 | 122036 | 81 | 81 | 0.06% | 0.07% |  |
| C | 141792 | 122033 | 5932 | 5932 | 4.18% | 4.86% |  |
| D | 141792 | 122040 | 1109 | 1109 | 0.78% | 0.91% | 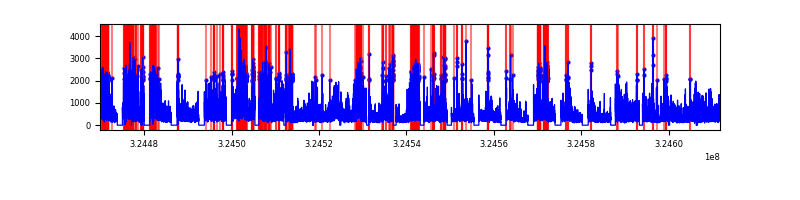 |
Top three noisy pixels from each quadrant. If the there are fewer than three noisy pixels in the level2.evt file, extra rows are filled as -1
| Pixel properties | Quadrant properties | ||||||
|---|---|---|---|---|---|---|---|
| Quadrant | DetID | PixID | Counts | Sigma | Mean | Median | Sigma |
| A | 6 | 16 | 1650726 | 1111.84 | 6877 | 6791 | 1478.6 |
| A | 13 | 254 | 185636 | 120.96 | 6877 | 6791 | 1478.6 |
| A | 0 | 226 | 44177 | 25.29 | 6877 | 6791 | 1478.6 |
| B | 3 | 64 | 1934780 | 1494.13 | 6892 | 6745 | 1290.4 |
| B | 0 | 190 | 272828 | 206.2 | 6892 | 6745 | 1290.4 |
| B | 7 | 202 | 139815 | 103.12 | 6892 | 6745 | 1290.4 |
| C | 7 | 247 | 44803558 | 30547.63 | 6235 | 6241 | 1466.5 |
| C | 2 | 16 | 1584225 | 1076.04 | 6235 | 6241 | 1466.5 |
| C | 10 | 9 | 861923 | 583.5 | 6235 | 6241 | 1466.5 |
| D | 8 | 195 | 25216674 | 16381.74 | 6574 | 6370 | 1538.9 |
| D | 12 | 218 | 5767306 | 3743.48 | 6574 | 6370 | 1538.9 |
| D | 1 | 52 | 3482567 | 2258.84 | 6574 | 6370 | 1538.9 |
Histogram calculated using DETX and DETY for each event in the final _common_clean file
| Quadrant A |  |
 |
Quadrant B |
|---|---|---|---|
| Quadrant D |  |
 |
Quadrant C |
| Plot type | Count rate plots | Images |
|---|---|---|
| Comparison with Poisson distribution Blue bars denote a histogram of data divided into 1 sec bins. Red curve is a Poisson curve with rate = median count rate of data. |
 |
 |
| Quadrant-wise count rates Data is divided into 100 sec bins |
 |
|
| Module-wise count rates for Quadrant A Data is divided into 100 sec bins |
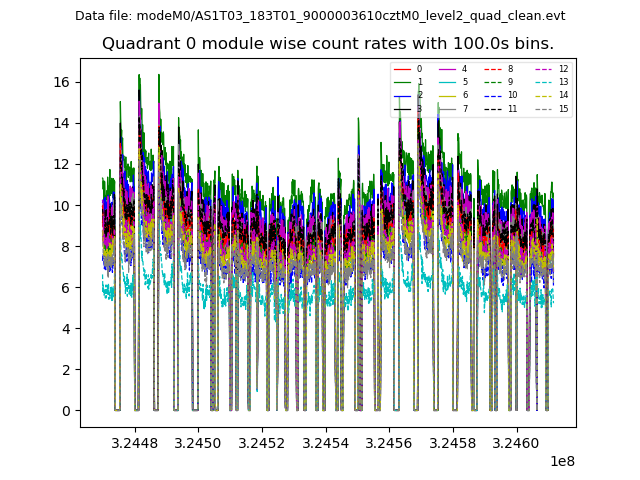 |
 |
| Module-wise count rates for Quadrant B Data is divided into 100 sec bins |
 |
 |
| Module-wise count rates for Quadrant C Data is divided into 100 sec bins |
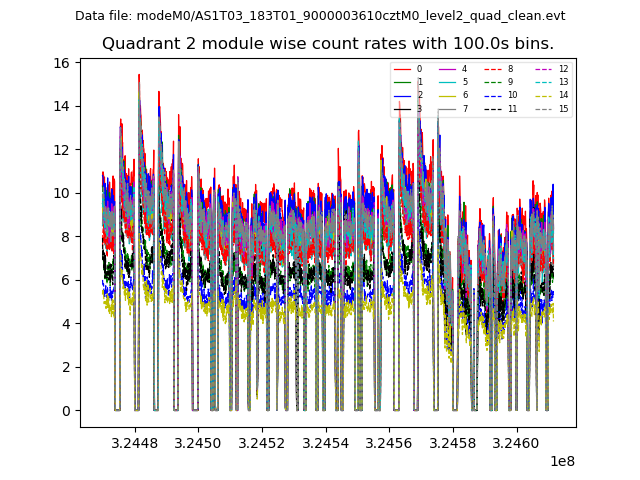 |
 |
| Module-wise count rates for Quadrant D Data is divided into 100 sec bins |
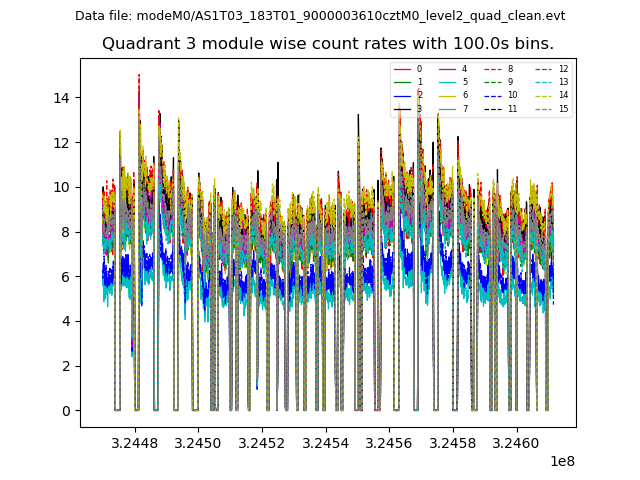 |
 |
| Parameter | Plot |
|---|---|
| CZT HV Monitor |  |
| D_VDD |  |
| Temperature 1 |  |
| Veto HV Monitor |  |
| Veto LLD |  |
| Alpha Counter |  |
| _CPM_Rate | 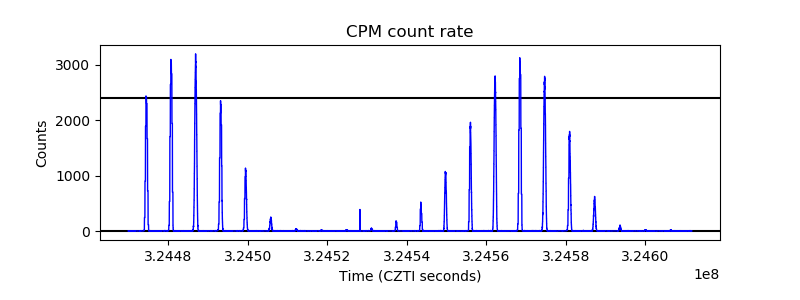 |
| CZT Counter |  |
| +2.5 Volts monitor |  |
| +5 Volts monitor |  |
| _ROLL_ROT |  |
| _Roll_DEC |  |
| _Roll_RA |  |
| Veto Counter | 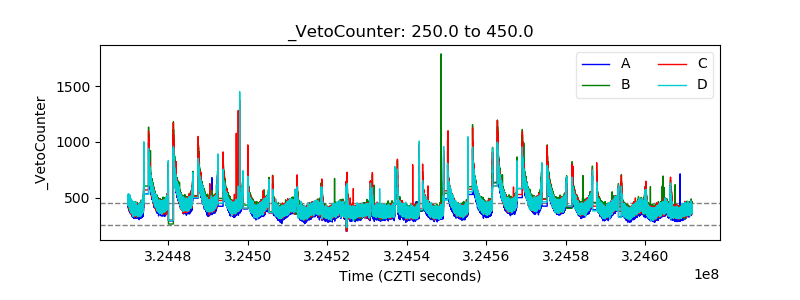 |