| Param | Original file | Final file |
|---|---|---|
| Filename | modeM0/AS1T03_187T01_9000003608cztM0_level2_bc.evt | modeM0/AS1T03_187T01_9000003608cztM0_level2_quad_clean.evt |
| Size (bytes) | 2,785,469,760 | 1,025,314,560 |
| Size | 2.6 GB | 977.8 MB |
| Events in quadrant A | 13,287,375 | 6,964,829 |
| Events in quadrant B | 14,038,222 | 6,998,021 |
| Events in quadrant C | 13,658,343 | 6,583,797 |
| Events in quadrant D | 39,207,165 | 6,309,651 |
| Mode SS | |||
|---|---|---|---|
| Quadrant | BADHDUFLAG | Total packets | Discarded packets |
| A | 0 | 1334 | 0 |
| B | 0 | 1334 | 0 |
| C | 0 | 1334 | 0 |
| D | 0 | 1334 | 0 |
| Mode M9 | |||
|---|---|---|---|
| Quadrant | BADHDUFLAG | Total packets | Discarded packets |
| A | 0 | 98 | 0 |
| B | 0 | 98 | 0 |
| C | 0 | 98 | 0 |
| D | 0 | 98 | 0 |
| Mode M0 | |||
|---|---|---|---|
| Quadrant | BADHDUFLAG | Total packets | Discarded packets |
| A | 0 | 126745 | 0 |
| B | 0 | 130222 | 0 |
| C | 0 | 130338 | 0 |
| D | 0 | 210268 | 0 |
| Quadrant | Total seconds | Saturated seconds | Saturation percentage |
|---|---|---|---|
| A | 60964 | 569 | 0.933338% |
| B | 60965 | 922 | 1.512343% |
| C | 60965 | 1012 | 1.659969% |
| D | 60965 | 4244 | 6.961371% |
Noise dominated data is calculated using 1-second bins in cleaned event files. If a bin has >2000 counts, and if more than 50% of those come from <1% of pixels, then it is considered to be noise-dominated and hence unusable.
| Quadrant | # 1 sec bins | Bins with >0 counts | Bins with >2000 counts | High rate bins dominated by noise | Noise dominated (total time) | Noise dominated (detector-on time) | Marked lightcurve |
|---|---|---|---|---|---|---|---|
| A | 75254 | 60968 | 32 | 32 | 0.04% | 0.05% |  |
| B | 75255 | 60965 | 28 | 28 | 0.04% | 0.05% |  |
| C | 75255 | 60966 | 31 | 31 | 0.04% | 0.05% |  |
| D | 75255 | 60966 | 1263 | 1263 | 1.68% | 2.07% |  |
Top three noisy pixels from each quadrant. If the there are fewer than three noisy pixels in the level2.evt file, extra rows are filled as -1
| Pixel properties | Quadrant properties | ||||||
|---|---|---|---|---|---|---|---|
| Quadrant | DetID | PixID | Counts | Sigma | Mean | Median | Sigma |
| A | 6 | 16 | 199504 | 266.47 | 3379 | 3325 | 736.2 |
| A | 13 | 254 | 92129 | 120.62 | 3379 | 3325 | 736.2 |
| A | 10 | 255 | 49422 | 62.61 | 3379 | 3325 | 736.2 |
| B | 3 | 64 | 899680 | 1414.63 | 3366 | 3293 | 633.7 |
| B | 0 | 190 | 109387 | 167.43 | 3366 | 3293 | 633.7 |
| B | 7 | 202 | 51523 | 76.11 | 3366 | 3293 | 633.7 |
| C | 2 | 16 | 1137464 | 1517.88 | 3168 | 3158 | 747.3 |
| C | 5 | 112 | 192834 | 253.82 | 3168 | 3158 | 747.3 |
| C | 3 | 233 | 77166 | 99.03 | 3168 | 3158 | 747.3 |
| D | 8 | 195 | 18408588 | 24344.35 | 3194 | 3088 | 756.0 |
| D | 1 | 52 | 4737643 | 6262.24 | 3194 | 3088 | 756.0 |
| D | 12 | 218 | 1718809 | 2269.33 | 3194 | 3088 | 756.0 |
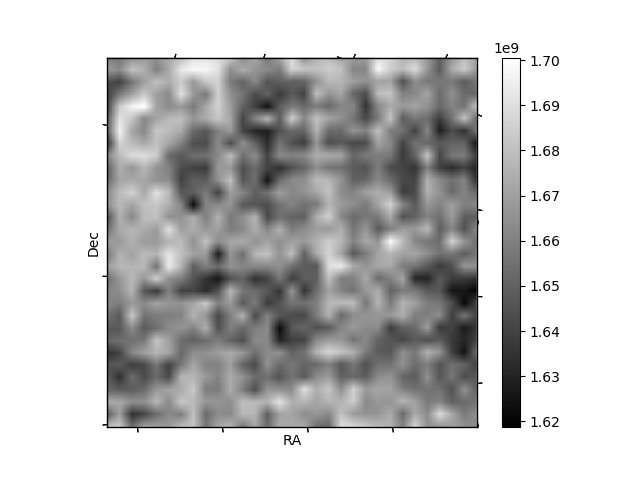
Histogram calculated using DETX and DETY for each event in the final _common_clean file
| Quadrant A |  |
 |
Quadrant B |
|---|---|---|---|
| Quadrant D |  |
 |
Quadrant C |
| Plot type | Count rate plots | Images |
|---|---|---|
| Comparison with Poisson distribution Blue bars denote a histogram of data divided into 1 sec bins. Red curve is a Poisson curve with rate = median count rate of data. |
 |
 |
| Quadrant-wise count rates Data is divided into 100 sec bins |
 |
|
| Module-wise count rates for Quadrant A Data is divided into 100 sec bins |
 |
 |
| Module-wise count rates for Quadrant B Data is divided into 100 sec bins |
 |
 |
| Module-wise count rates for Quadrant C Data is divided into 100 sec bins |
 |
 |
| Module-wise count rates for Quadrant D Data is divided into 100 sec bins |
 |
 |
| Parameter | Plot |
|---|---|
| CZT HV Monitor |  |
| D_VDD |  |
| Temperature 1 |  |
| Veto HV Monitor |  |
| Veto LLD | 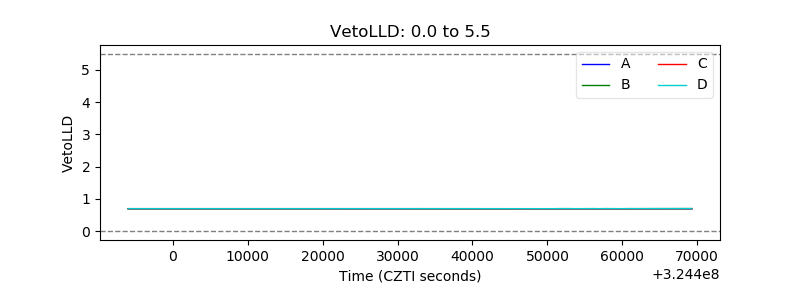 |
| Alpha Counter |  |
| _CPM_Rate | 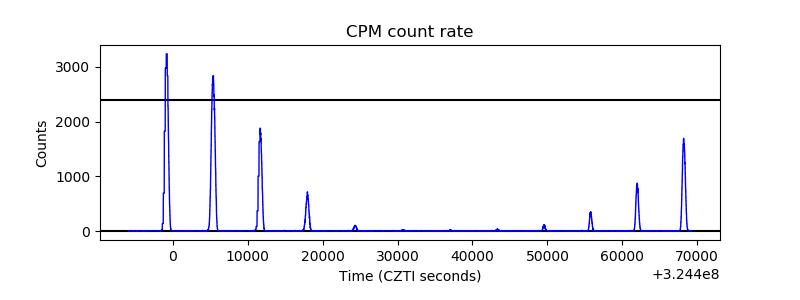 |
| CZT Counter |  |
| +2.5 Volts monitor |  |
| +5 Volts monitor |  |
| _ROLL_ROT |  |
| _Roll_DEC |  |
| _Roll_RA |  |
| Veto Counter |  |