| Param | Original file | Final file |
|---|---|---|
| Filename | modeM0/AS1T03_183T01_9000003606cztM0_level2_bc.evt | modeM0/AS1T03_183T01_9000003606cztM0_level2_quad_clean.evt |
| Size (bytes) | 25,177,872,960 | 10,170,429,120 |
| Size | 23.4 GB | 9.5 GB |
| Events in quadrant A | 145,713,167 | 69,691,991 |
| Events in quadrant B | 180,696,311 | 69,639,211 |
| Events in quadrant C | 146,034,286 | 66,917,782 |
| Events in quadrant D | 252,571,089 | 64,036,327 |
| Mode M0 | |||
|---|---|---|---|
| Quadrant | BADHDUFLAG | Total packets | Discarded packets |
| A | 0 | 1312994 | 0 |
| B | 0 | 1441051 | 0 |
| C | 0 | 1312083 | 0 |
| D | 0 | 1653227 | 0 |
| Mode SS | |||
|---|---|---|---|
| Quadrant | BADHDUFLAG | Total packets | Discarded packets |
| A | 0 | 6005 | 0 |
| B | 0 | 6005 | 0 |
| C | 0 | 6005 | 0 |
| D | 0 | 6005 | 0 |
| Mode M9 | |||
|---|---|---|---|
| Quadrant | BADHDUFLAG | Total packets | Discarded packets |
| A | 0 | 966 | 0 |
| B | 0 | 967 | 0 |
| C | 0 | 967 | 0 |
| D | 0 | 967 | 0 |
| Quadrant | Total seconds | Saturated seconds | Saturation percentage |
|---|---|---|---|
| A | 590338 | 11911 | 2.017658% |
| B | 590338 | 29931 | 5.070146% |
| C | 590338 | 16693 | 2.827702% |
| D | 590337 | 28315 | 4.796413% |
Noise dominated data is calculated using 1-second bins in cleaned event files. If a bin has >2000 counts, and if more than 50% of those come from <1% of pixels, then it is considered to be noise-dominated and hence unusable.
| Quadrant | # 1 sec bins | Bins with >0 counts | Bins with >2000 counts | High rate bins dominated by noise | Noise dominated (total time) | Noise dominated (detector-on time) | Marked lightcurve |
|---|---|---|---|---|---|---|---|
| A | 691051 | 590346 | 245 | 245 | 0.04% | 0.04% |  |
| B | 691049 | 590268 | 3385 | 3385 | 0.49% | 0.57% |  |
| C | 691049 | 590323 | 1763 | 1763 | 0.26% | 0.30% |  |
| D | 691049 | 590306 | 5830 | 5830 | 0.84% | 0.99% |  |
Top three noisy pixels from each quadrant. If the there are fewer than three noisy pixels in the level2.evt file, extra rows are filled as -1
| Pixel properties | Quadrant properties | ||||||
|---|---|---|---|---|---|---|---|
| Quadrant | DetID | PixID | Counts | Sigma | Mean | Median | Sigma |
| A | 14 | 111 | 20821891 | 3010.17 | 31691 | 31245 | 6906.8 |
| A | 4 | 2 | 2466463 | 352.58 | 31691 | 31245 | 6906.8 |
| A | 13 | 254 | 885442 | 123.67 | 31691 | 31245 | 6906.8 |
| B | 3 | 64 | 53193775 | 8957.74 | 31621 | 30971 | 5934.8 |
| B | 4 | 200 | 1392935 | 229.49 | 31621 | 30971 | 5934.8 |
| B | 5 | 172 | 1121988 | 183.83 | 31621 | 30971 | 5934.8 |
| C | 2 | 16 | 22379599 | 3118.35 | 30299 | 30251 | 7167.0 |
| C | 10 | 9 | 3412825 | 471.96 | 30299 | 30251 | 7167.0 |
| C | 7 | 247 | 2513676 | 346.51 | 30299 | 30251 | 7167.0 |
| D | 1 | 52 | 62296064 | 8748.03 | 30427 | 29453 | 7117.8 |
| D | 12 | 218 | 31159136 | 4373.51 | 30427 | 29453 | 7117.8 |
| D | 8 | 195 | 23770926 | 3335.51 | 30427 | 29453 | 7117.8 |
Histogram calculated using DETX and DETY for each event in the final _common_clean file
| Quadrant A |  |
 |
Quadrant B |
|---|---|---|---|
| Quadrant D |  |
 |
Quadrant C |
| Plot type | Count rate plots | Images |
|---|---|---|
| Comparison with Poisson distribution Blue bars denote a histogram of data divided into 1 sec bins. Red curve is a Poisson curve with rate = median count rate of data. |
 |
 |
| Quadrant-wise count rates Data is divided into 100 sec bins |
 |
|
| Module-wise count rates for Quadrant A Data is divided into 100 sec bins |
 |
 |
| Module-wise count rates for Quadrant B Data is divided into 100 sec bins |
 |
 |
| Module-wise count rates for Quadrant C Data is divided into 100 sec bins |
 |
 |
| Module-wise count rates for Quadrant D Data is divided into 100 sec bins |
 |
 |
| Parameter | Plot |
|---|---|
| CZT HV Monitor |  |
| D_VDD | 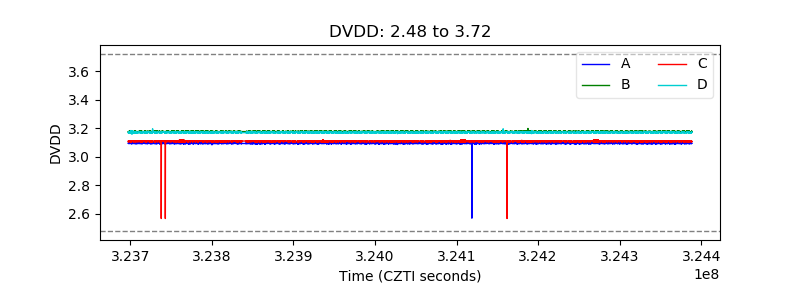 |
| Temperature 1 |  |
| Veto HV Monitor |  |
| Veto LLD |  |
| Alpha Counter |  |
| _CPM_Rate |  |
| CZT Counter |  |
| +2.5 Volts monitor |  |
| +5 Volts monitor |  |
| _ROLL_ROT |  |
| _Roll_DEC |  |
| _Roll_RA |  |
| Veto Counter |  |