| Param | Original file | Final file |
|---|---|---|
| Filename | modeM0/AS1A07_001T01_9000003598cztM0_level2_bc.evt | modeM0/AS1A07_001T01_9000003598cztM0_level2_quad_clean.evt |
| Size (bytes) | 489,432,960 | 235,120,320 |
| Size | 466.8 MB | 224.2 MB |
| Events in quadrant A | 3,152,389 | 1,571,912 |
| Events in quadrant B | 3,322,464 | 1,597,820 |
| Events in quadrant C | 3,458,619 | 1,486,102 |
| Events in quadrant D | 3,890,798 | 1,461,863 |
| Mode M0 | |||
|---|---|---|---|
| Quadrant | BADHDUFLAG | Total packets | Discarded packets |
| A | 0 | 30234 | 0 |
| B | 0 | 31075 | 0 |
| C | 0 | 31362 | 0 |
| D | 0 | 32001 | 0 |
| Mode M9 | |||
|---|---|---|---|
| Quadrant | BADHDUFLAG | Total packets | Discarded packets |
| A | 0 | 35 | 0 |
| B | 0 | 35 | 0 |
| C | 0 | 35 | 0 |
| D | 0 | 35 | 0 |
| Mode SS | |||
|---|---|---|---|
| Quadrant | BADHDUFLAG | Total packets | Discarded packets |
| A | 0 | 298 | 0 |
| B | 0 | 298 | 0 |
| C | 0 | 298 | 0 |
| D | 0 | 298 | 0 |
| Quadrant | Total seconds | Saturated seconds | Saturation percentage |
|---|---|---|---|
| A | 14544 | 59 | 0.405666% |
| B | 14544 | 134 | 0.921342% |
| C | 14544 | 127 | 0.873212% |
| D | 14544 | 49 | 0.336909% |
Noise dominated data is calculated using 1-second bins in cleaned event files. If a bin has >2000 counts, and if more than 50% of those come from <1% of pixels, then it is considered to be noise-dominated and hence unusable.
| Quadrant | # 1 sec bins | Bins with >0 counts | Bins with >2000 counts | High rate bins dominated by noise | Noise dominated (total time) | Noise dominated (detector-on time) | Marked lightcurve |
|---|---|---|---|---|---|---|---|
| A | 18099 | 14543 | 0 | 0 | 0.00% | 0.00% |  |
| B | 18099 | 14544 | 1 | 1 | 0.01% | 0.01% |  |
| C | 18099 | 14543 | 0 | 0 | 0.00% | 0.00% |  |
| D | 18099 | 14543 | 11 | 11 | 0.06% | 0.08% |  |
Top three noisy pixels from each quadrant. If the there are fewer than three noisy pixels in the level2.evt file, extra rows are filled as -1
| Pixel properties | Quadrant properties | ||||||
|---|---|---|---|---|---|---|---|
| Quadrant | DetID | PixID | Counts | Sigma | Mean | Median | Sigma |
| A | 13 | 254 | 23435 | 126.59 | 817 | 805 | 178.8 |
| A | 0 | 226 | 5342 | 25.38 | 817 | 805 | 178.8 |
| A | 12 | 194 | 5001 | 23.47 | 817 | 805 | 178.8 |
| B | 15 | 33 | 115558 | 729.21 | 822 | 805 | 157.4 |
| B | 3 | 64 | 17052 | 103.24 | 822 | 805 | 157.4 |
| B | 0 | 229 | 12724 | 75.74 | 822 | 805 | 157.4 |
| C | 7 | 247 | 461882 | 2530.93 | 766 | 764 | 182.2 |
| C | 2 | 16 | 49407 | 266.99 | 766 | 764 | 182.2 |
| C | 3 | 233 | 5856 | 27.95 | 766 | 764 | 182.2 |
| D | 1 | 52 | 705436 | 3861.99 | 785 | 757 | 182.5 |
| D | 8 | 195 | 74069 | 401.78 | 785 | 757 | 182.5 |
| D | 2 | 234 | 65964 | 357.36 | 785 | 757 | 182.5 |
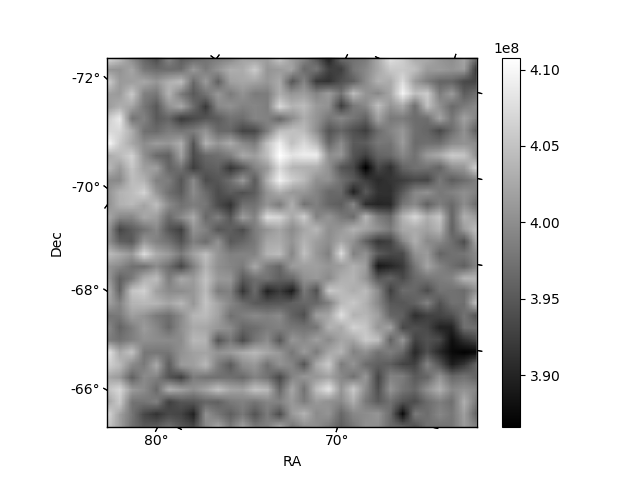
Histogram calculated using DETX and DETY for each event in the final _common_clean file
| Quadrant A |  |
 |
Quadrant B |
|---|---|---|---|
| Quadrant D |  |
 |
Quadrant C |
| Plot type | Count rate plots | Images |
|---|---|---|
| Comparison with Poisson distribution Blue bars denote a histogram of data divided into 1 sec bins. Red curve is a Poisson curve with rate = median count rate of data. |
 |
 |
| Quadrant-wise count rates Data is divided into 100 sec bins |
 |
|
| Module-wise count rates for Quadrant A Data is divided into 100 sec bins |
 |
 |
| Module-wise count rates for Quadrant B Data is divided into 100 sec bins |
 |
 |
| Module-wise count rates for Quadrant C Data is divided into 100 sec bins |
 |
 |
| Module-wise count rates for Quadrant D Data is divided into 100 sec bins |
 |
 |
| Parameter | Plot |
|---|---|
| CZT HV Monitor |  |
| D_VDD |  |
| Temperature 1 |  |
| Veto HV Monitor | 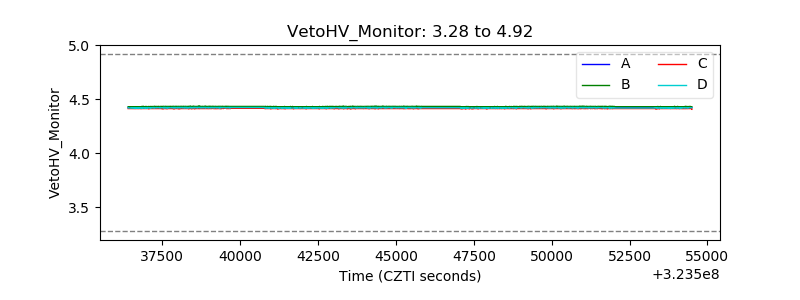 |
| Veto LLD |  |
| Alpha Counter |  |
| _CPM_Rate | 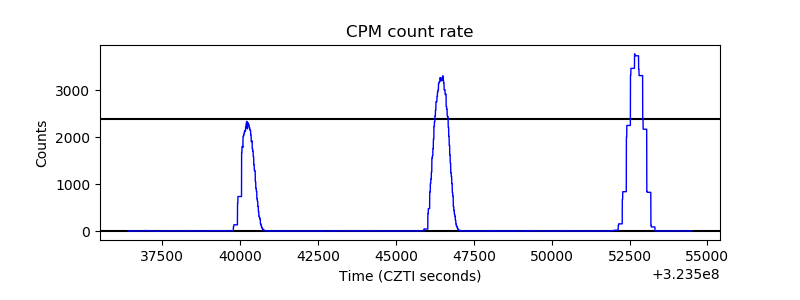 |
| CZT Counter |  |
| +2.5 Volts monitor |  |
| +5 Volts monitor | 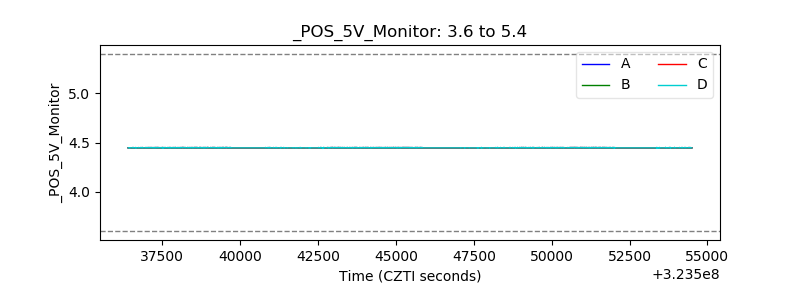 |
| _ROLL_ROT | 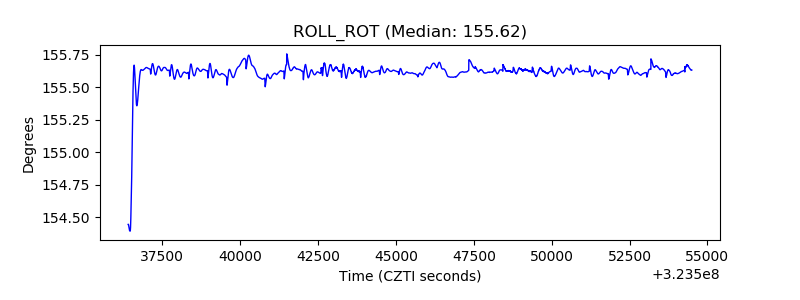 |
| _Roll_DEC | 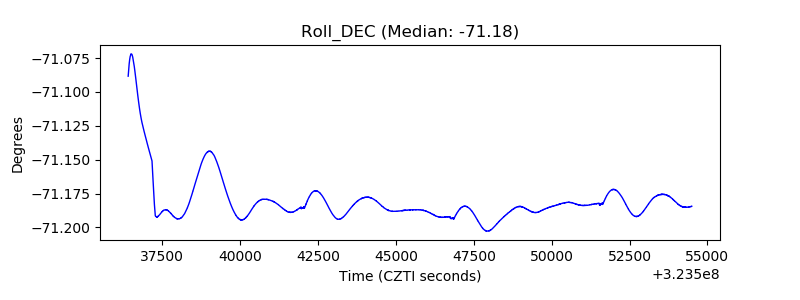 |
| _Roll_RA |  |
| Veto Counter |  |