| Param | Original file | Final file |
|---|---|---|
| Filename | modeM0/AS1A07_047T08_9000003590cztM0_level2_bc.evt | modeM0/AS1A07_047T08_9000003590cztM0_level2_quad_clean.evt |
| Size (bytes) | 2,289,536,640 | 947,269,440 |
| Size | 2.1 GB | 903.4 MB |
| Events in quadrant A | 10,210,342 | 6,565,900 |
| Events in quadrant B | 10,738,422 | 6,676,389 |
| Events in quadrant C | 16,458,424 | 6,306,078 |
| Events in quadrant D | 28,793,717 | 5,979,325 |
| Mode SS | |||
|---|---|---|---|
| Quadrant | BADHDUFLAG | Total packets | Discarded packets |
| A | 0 | 938 | 0 |
| B | 0 | 938 | 0 |
| C | 0 | 938 | 0 |
| D | 0 | 938 | 0 |
| Mode M9 | |||
|---|---|---|---|
| Quadrant | BADHDUFLAG | Total packets | Discarded packets |
| A | 0 | 101 | 0 |
| B | 0 | 101 | 0 |
| C | 0 | 101 | 0 |
| D | 0 | 101 | 0 |
| Mode M0 | |||
|---|---|---|---|
| Quadrant | BADHDUFLAG | Total packets | Discarded packets |
| A | 0 | 95342 | 0 |
| B | 0 | 98038 | 0 |
| C | 0 | 119166 | 0 |
| D | 0 | 158893 | 0 |
| Quadrant | Total seconds | Saturated seconds | Saturation percentage |
|---|---|---|---|
| A | 46153 | 319 | 0.691179% |
| B | 46153 | 554 | 1.200355% |
| C | 46153 | 920 | 1.993370% |
| D | 46153 | 3097 | 6.710290% |
Noise dominated data is calculated using 1-second bins in cleaned event files. If a bin has >2000 counts, and if more than 50% of those come from <1% of pixels, then it is considered to be noise-dominated and hence unusable.
| Quadrant | # 1 sec bins | Bins with >0 counts | Bins with >2000 counts | High rate bins dominated by noise | Noise dominated (total time) | Noise dominated (detector-on time) | Marked lightcurve |
|---|---|---|---|---|---|---|---|
| A | 56228 | 46147 | 0 | 0 | 0.00% | 0.00% |  |
| B | 56228 | 46147 | 1 | 1 | 0.00% | 0.00% |  |
| C | 56228 | 46145 | 14 | 14 | 0.02% | 0.03% |  |
| D | 56228 | 46144 | 679 | 679 | 1.21% | 1.47% |  |
Top three noisy pixels from each quadrant. If the there are fewer than three noisy pixels in the level2.evt file, extra rows are filled as -1
| Pixel properties | Quadrant properties | ||||||
|---|---|---|---|---|---|---|---|
| Quadrant | DetID | PixID | Counts | Sigma | Mean | Median | Sigma |
| A | 13 | 254 | 69904 | 119.83 | 2638 | 2605 | 561.6 |
| A | 0 | 226 | 16768 | 25.22 | 2638 | 2605 | 561.6 |
| A | 2 | 79 | 16643 | 24.99 | 2638 | 2605 | 561.6 |
| B | 12 | 17 | 275123 | 554.18 | 2663 | 2611 | 491.7 |
| B | 15 | 33 | 121230 | 241.22 | 2663 | 2611 | 491.7 |
| B | 0 | 230 | 63004 | 122.82 | 2663 | 2611 | 491.7 |
| C | 7 | 247 | 5824941 | 9798.39 | 2536 | 2540 | 594.2 |
| C | 2 | 16 | 844725 | 1417.29 | 2536 | 2540 | 594.2 |
| C | 3 | 233 | 20810 | 30.75 | 2536 | 2540 | 594.2 |
| D | 8 | 195 | 9303895 | 15898.33 | 2528 | 2454 | 585.1 |
| D | 1 | 52 | 8225775 | 14055.58 | 2528 | 2454 | 585.1 |
| D | 12 | 233 | 894277 | 1524.33 | 2528 | 2454 | 585.1 |
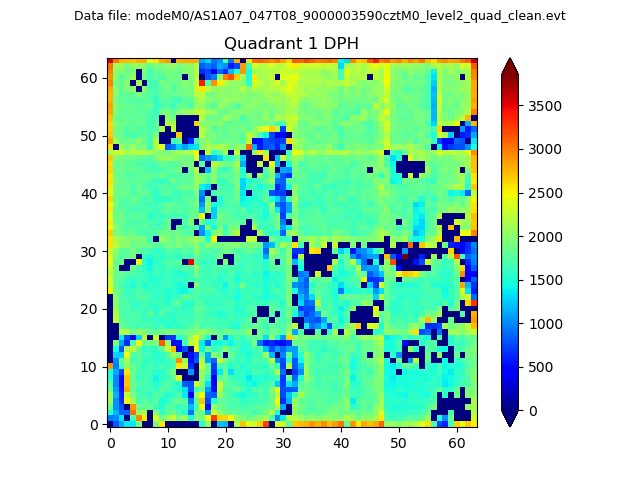
Histogram calculated using DETX and DETY for each event in the final _common_clean file
| Quadrant A |  |
 |
Quadrant B |
|---|---|---|---|
| Quadrant D |  |
 |
Quadrant C |
| Plot type | Count rate plots | Images |
|---|---|---|
| Comparison with Poisson distribution Blue bars denote a histogram of data divided into 1 sec bins. Red curve is a Poisson curve with rate = median count rate of data. |
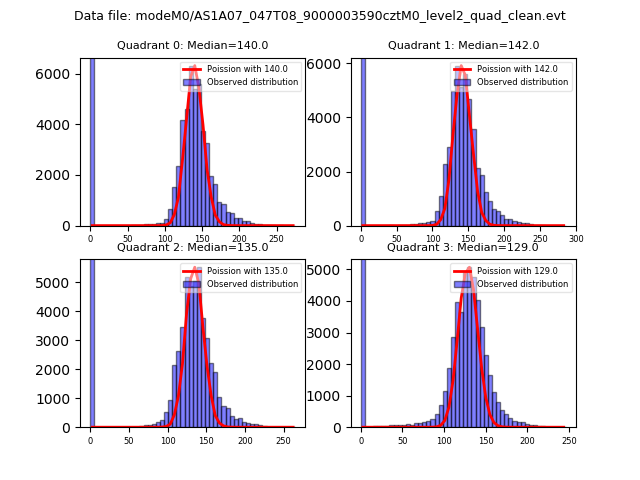 |
 |
| Quadrant-wise count rates Data is divided into 100 sec bins |
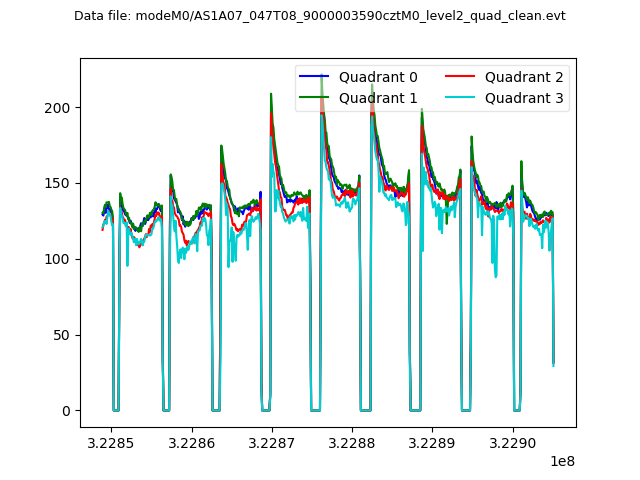 |
|
| Module-wise count rates for Quadrant A Data is divided into 100 sec bins |
 |
 |
| Module-wise count rates for Quadrant B Data is divided into 100 sec bins |
 |
 |
| Module-wise count rates for Quadrant C Data is divided into 100 sec bins |
 |
 |
| Module-wise count rates for Quadrant D Data is divided into 100 sec bins |
 |
 |
| Parameter | Plot |
|---|---|
| CZT HV Monitor |  |
| D_VDD |  |
| Temperature 1 |  |
| Veto HV Monitor |  |
| Veto LLD |  |
| Alpha Counter |  |
| _CPM_Rate |  |
| CZT Counter |  |
| +2.5 Volts monitor |  |
| +5 Volts monitor |  |
| _ROLL_ROT |  |
| _Roll_DEC |  |
| _Roll_RA |  |
| Veto Counter |  |