| Param | Original file | Final file |
|---|---|---|
| Filename | modeM0/AS1A07_118T01_9000003586cztM0_level2_bc.evt | modeM0/AS1A07_118T01_9000003586cztM0_level2_quad_clean.evt |
| Size (bytes) | 9,477,924,480 | 3,081,265,920 |
| Size | 8.8 GB | 2.9 GB |
| Events in quadrant A | 52,296,498 | 20,000,077 |
| Events in quadrant B | 53,926,135 | 20,534,515 |
| Events in quadrant C | 59,448,436 | 19,567,973 |
| Events in quadrant D | 107,000,354 | 18,750,308 |
| Mode M0 | |||
|---|---|---|---|
| Quadrant | BADHDUFLAG | Total packets | Discarded packets |
| A | 0 | 484953 | 0 |
| B | 0 | 499434 | 0 |
| C | 0 | 513931 | 0 |
| D | 0 | 679226 | 0 |
| Mode SS | |||
|---|---|---|---|
| Quadrant | BADHDUFLAG | Total packets | Discarded packets |
| A | 0 | 2302 | 0 |
| B | 0 | 2302 | 0 |
| C | 0 | 2302 | 0 |
| D | 0 | 2302 | 0 |
| Mode M9 | |||
|---|---|---|---|
| Quadrant | BADHDUFLAG | Total packets | Discarded packets |
| A | 0 | 366 | 0 |
| B | 0 | 366 | 0 |
| C | 0 | 366 | 0 |
| D | 0 | 366 | 0 |
| Quadrant | Total seconds | Saturated seconds | Saturation percentage |
|---|---|---|---|
| A | 226117 | 3710 | 1.640744% |
| B | 226117 | 5548 | 2.453597% |
| C | 226117 | 5606 | 2.479247% |
| D | 226118 | 15842 | 7.006076% |
Noise dominated data is calculated using 1-second bins in cleaned event files. If a bin has >2000 counts, and if more than 50% of those come from <1% of pixels, then it is considered to be noise-dominated and hence unusable.
| Quadrant | # 1 sec bins | Bins with >0 counts | Bins with >2000 counts | High rate bins dominated by noise | Noise dominated (total time) | Noise dominated (detector-on time) | Marked lightcurve |
|---|---|---|---|---|---|---|---|
| A | 273987 | 226094 | 513 | 513 | 0.19% | 0.23% |  |
| B | 273987 | 226092 | 73 | 73 | 0.03% | 0.03% | 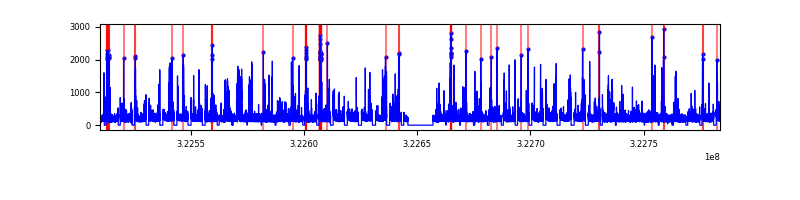 |
| C | 273987 | 226095 | 243 | 243 | 0.09% | 0.11% |  |
| D | 273987 | 226084 | 2382 | 2382 | 0.87% | 1.05% |  |
Top three noisy pixels from each quadrant. If the there are fewer than three noisy pixels in the level2.evt file, extra rows are filled as -1
| Pixel properties | Quadrant properties | ||||||
|---|---|---|---|---|---|---|---|
| Quadrant | DetID | PixID | Counts | Sigma | Mean | Median | Sigma |
| A | 6 | 16 | 3213672 | 1217.44 | 12317 | 12103 | 2629.8 |
| A | 10 | 229 | 1052602 | 395.66 | 12317 | 12103 | 2629.8 |
| A | 3 | 1 | 451536 | 167.1 | 12317 | 12103 | 2629.8 |
| B | 0 | 245 | 1940856 | 837.34 | 12472 | 12170 | 2303.4 |
| B | 12 | 17 | 1692772 | 729.63 | 12472 | 12170 | 2303.4 |
| B | 15 | 33 | 1115837 | 479.16 | 12472 | 12170 | 2303.4 |
| C | 7 | 247 | 8171111 | 2918.3 | 11981 | 11951 | 2795.9 |
| C | 2 | 16 | 4868987 | 1737.22 | 11981 | 11951 | 2795.9 |
| C | 3 | 233 | 183738 | 61.44 | 11981 | 11951 | 2795.9 |
| D | 8 | 195 | 22432748 | 8050.94 | 11935 | 11520 | 2784.9 |
| D | 7 | 238 | 14462685 | 5189.07 | 11935 | 11520 | 2784.9 |
| D | 1 | 52 | 12659616 | 4541.63 | 11935 | 11520 | 2784.9 |
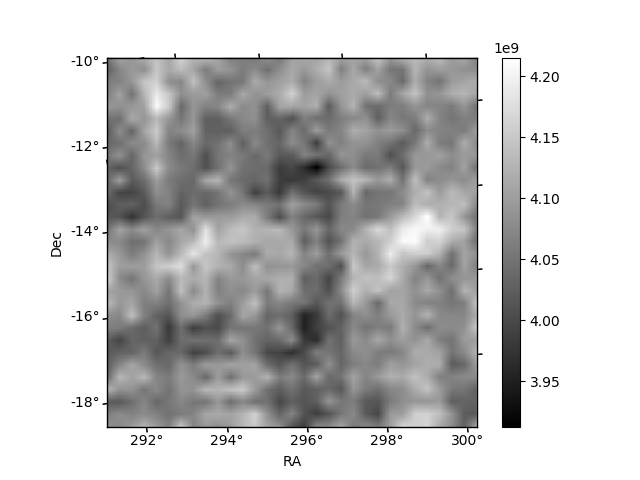
Histogram calculated using DETX and DETY for each event in the final _common_clean file
| Quadrant A | 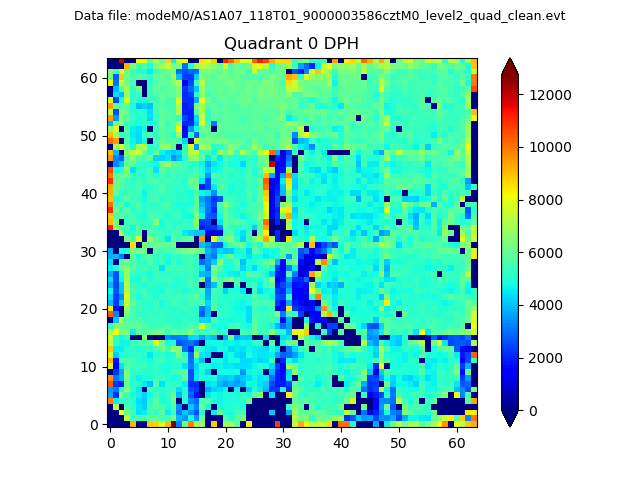 |
 |
Quadrant B |
|---|---|---|---|
| Quadrant D |  |
 |
Quadrant C |
| Plot type | Count rate plots | Images |
|---|---|---|
| Comparison with Poisson distribution Blue bars denote a histogram of data divided into 1 sec bins. Red curve is a Poisson curve with rate = median count rate of data. |
 |
 |
| Quadrant-wise count rates Data is divided into 100 sec bins |
 |
|
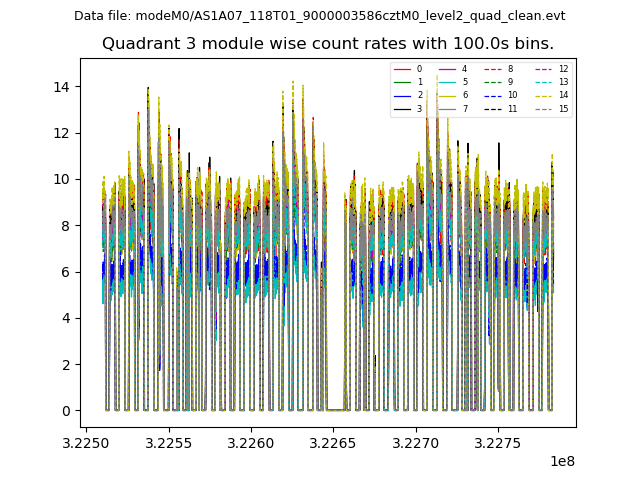
| Module-wise count rates for Quadrant A Data is divided into 100 sec bins |
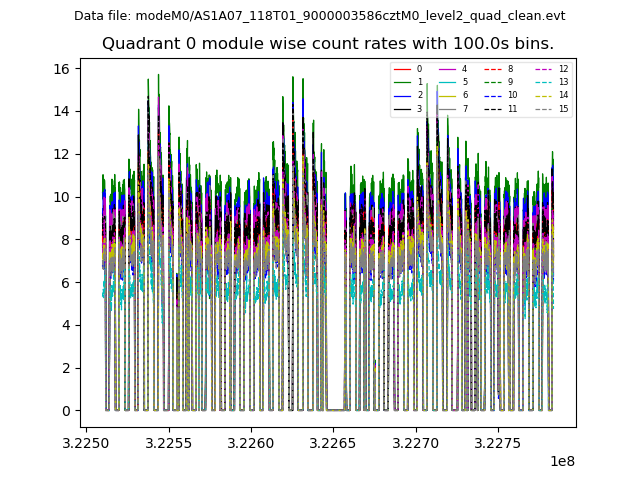 |
 |
| Module-wise count rates for Quadrant B Data is divided into 100 sec bins |
 |
 |
| Module-wise count rates for Quadrant C Data is divided into 100 sec bins |
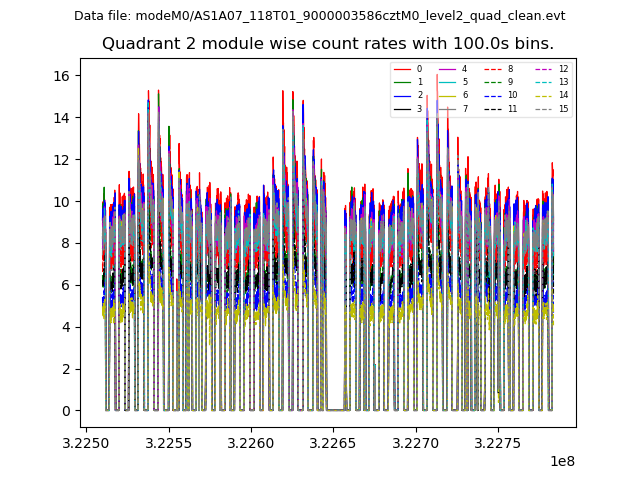 |
 |
| Module-wise count rates for Quadrant D Data is divided into 100 sec bins |
 |
 |
| Parameter | Plot |
|---|---|
| CZT HV Monitor |  |
| D_VDD |  |
| Temperature 1 |  |
| Veto HV Monitor |  |
| Veto LLD |  |
| Alpha Counter |  |
| _CPM_Rate |  |
| CZT Counter |  |
| +2.5 Volts monitor |  |
| +5 Volts monitor |  |
| _ROLL_ROT | 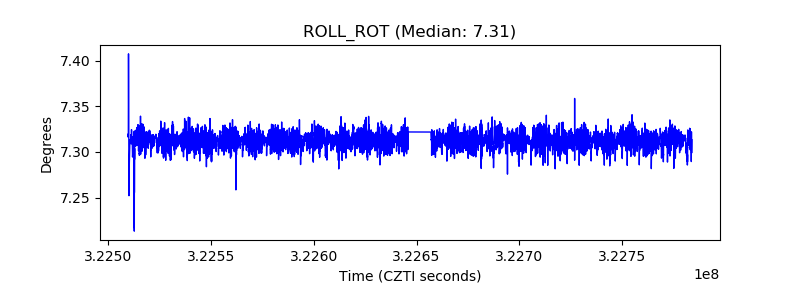 |
| _Roll_DEC |  |
| _Roll_RA |  |
| Veto Counter |  |