| Param | Original file | Final file |
|---|---|---|
| Filename | modeM0/AS1A07_010T12_9000003582cztM0_level2_bc.evt | modeM0/AS1A07_010T12_9000003582cztM0_level2_quad_clean.evt |
| Size (bytes) | 2,572,663,680 | 940,129,920 |
| Size | 2.4 GB | 896.6 MB |
| Events in quadrant A | 14,117,823 | 6,144,573 |
| Events in quadrant B | 15,252,052 | 6,224,046 |
| Events in quadrant C | 16,157,133 | 5,992,675 |
| Events in quadrant D | 28,093,531 | 5,790,919 |
| Mode M0 | |||
|---|---|---|---|
| Quadrant | BADHDUFLAG | Total packets | Discarded packets |
| A | 0 | 131951 | 0 |
| B | 0 | 136830 | 0 |
| C | 0 | 141223 | 0 |
| D | 0 | 178171 | 0 |
| Mode SS | |||
|---|---|---|---|
| Quadrant | BADHDUFLAG | Total packets | Discarded packets |
| A | 0 | 1288 | 0 |
| B | 0 | 1288 | 0 |
| C | 0 | 1288 | 0 |
| D | 0 | 1288 | 0 |
| Mode M9 | |||
|---|---|---|---|
| Quadrant | BADHDUFLAG | Total packets | Discarded packets |
| A | 0 | 111 | 0 |
| B | 0 | 111 | 0 |
| C | 0 | 111 | 0 |
| D | 0 | 111 | 0 |
| Quadrant | Total seconds | Saturated seconds | Saturation percentage |
|---|---|---|---|
| A | 63050 | 781 | 1.238699% |
| B | 63050 | 1172 | 1.858842% |
| C | 63050 | 1335 | 2.117367% |
| D | 63050 | 1863 | 2.954798% |
Noise dominated data is calculated using 1-second bins in cleaned event files. If a bin has >2000 counts, and if more than 50% of those come from <1% of pixels, then it is considered to be noise-dominated and hence unusable.
| Quadrant | # 1 sec bins | Bins with >0 counts | Bins with >2000 counts | High rate bins dominated by noise | Noise dominated (total time) | Noise dominated (detector-on time) | Marked lightcurve |
|---|---|---|---|---|---|---|---|
| A | 74300 | 63047 | 19 | 19 | 0.03% | 0.03% |  |
| B | 74300 | 63045 | 46 | 46 | 0.06% | 0.07% |  |
| C | 74300 | 63047 | 31 | 31 | 0.04% | 0.05% |  |
| D | 74300 | 63046 | 352 | 352 | 0.47% | 0.56% |  |
Top three noisy pixels from each quadrant. If the there are fewer than three noisy pixels in the level2.evt file, extra rows are filled as -1
| Pixel properties | Quadrant properties | ||||||
|---|---|---|---|---|---|---|---|
| Quadrant | DetID | PixID | Counts | Sigma | Mean | Median | Sigma |
| A | 6 | 16 | 357442 | 462.8 | 3556 | 3503 | 764.8 |
| A | 13 | 254 | 95865 | 120.77 | 3556 | 3503 | 764.8 |
| A | 3 | 1 | 33332 | 39.0 | 3556 | 3503 | 764.8 |
| B | 0 | 245 | 636303 | 962.71 | 3581 | 3520 | 657.3 |
| B | 12 | 17 | 198950 | 297.33 | 3581 | 3520 | 657.3 |
| B | 0 | 229 | 190421 | 284.35 | 3581 | 3520 | 657.3 |
| C | 7 | 247 | 1528608 | 1900.92 | 3426 | 3427 | 802.3 |
| C | 2 | 16 | 1134668 | 1409.93 | 3426 | 3427 | 802.3 |
| C | 0 | 239 | 259927 | 319.69 | 3426 | 3427 | 802.3 |
| D | 8 | 195 | 8527508 | 10491.53 | 3483 | 3367 | 812.5 |
| D | 7 | 238 | 3634335 | 4469.0 | 3483 | 3367 | 812.5 |
| D | 1 | 52 | 1479628 | 1816.99 | 3483 | 3367 | 812.5 |
Histogram calculated using DETX and DETY for each event in the final _common_clean file
| Quadrant A |  |
 |
Quadrant B |
|---|---|---|---|
| Quadrant D | 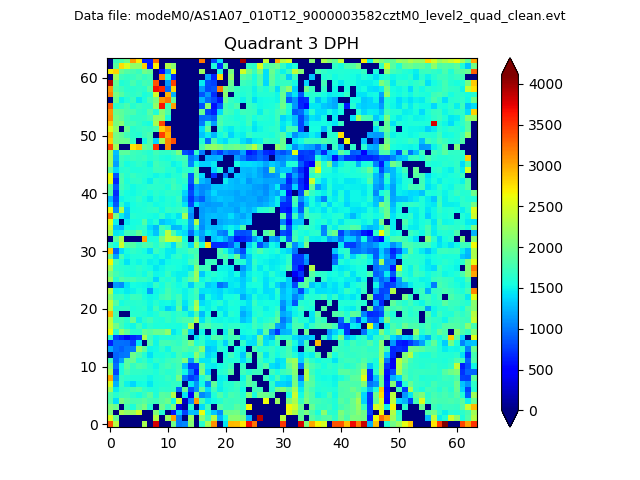 |
 |
Quadrant C |
| Plot type | Count rate plots | Images |
|---|---|---|
| Comparison with Poisson distribution Blue bars denote a histogram of data divided into 1 sec bins. Red curve is a Poisson curve with rate = median count rate of data. |
 |
 |
| Quadrant-wise count rates Data is divided into 100 sec bins |
 |
|
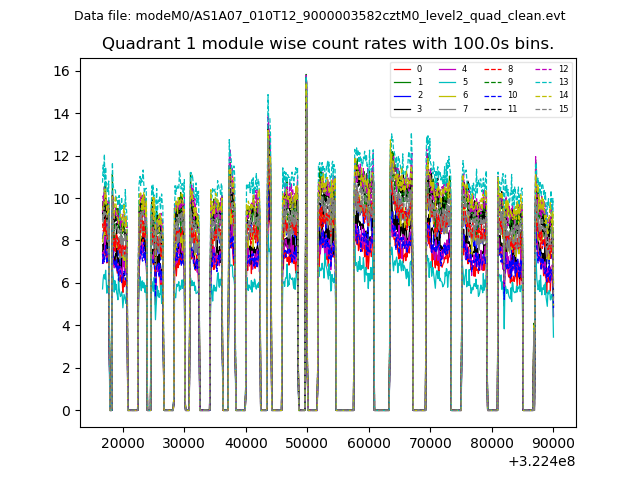
| Module-wise count rates for Quadrant A Data is divided into 100 sec bins |
 |
 |
| Module-wise count rates for Quadrant B Data is divided into 100 sec bins |
 |
 |
| Module-wise count rates for Quadrant C Data is divided into 100 sec bins |
 |
 |
| Module-wise count rates for Quadrant D Data is divided into 100 sec bins |
 |
 |
| Parameter | Plot |
|---|---|
| CZT HV Monitor |  |
| D_VDD |  |
| Temperature 1 |  |
| Veto HV Monitor | 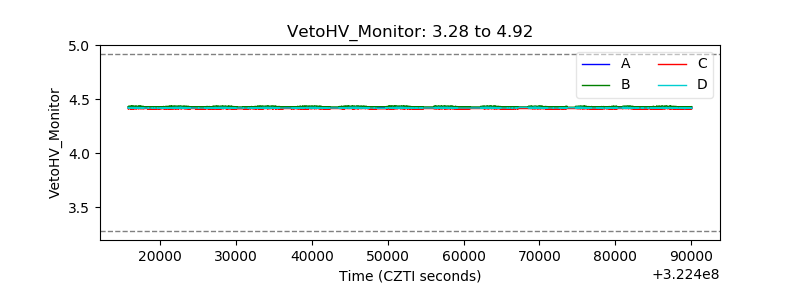 |
| Veto LLD |  |
| Alpha Counter |  |
| _CPM_Rate | 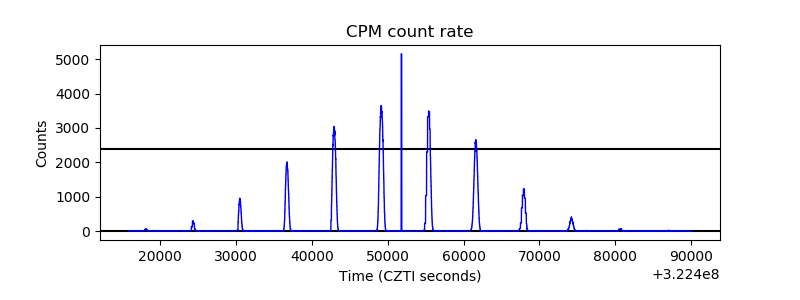 |
| CZT Counter | 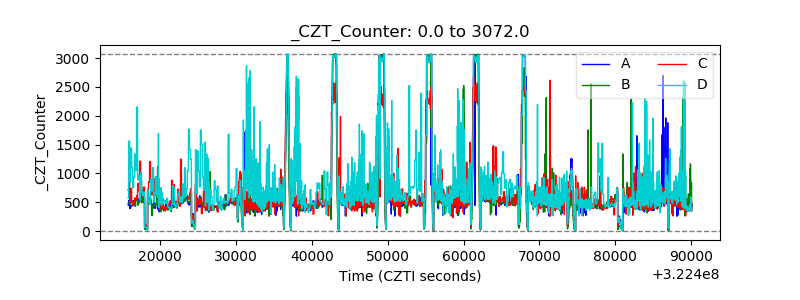 |
| +2.5 Volts monitor |  |
| +5 Volts monitor |  |
| _ROLL_ROT |  |
| _Roll_DEC |  |
| _Roll_RA | 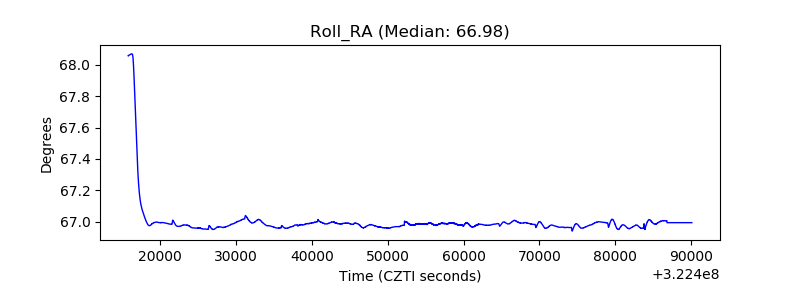 |
| Veto Counter |  |