| Param | Original file | Final file |
|---|---|---|
| Filename | modeM0/AS1A07_160T05_9000003580cztM0_level2_bc.evt | modeM0/AS1A07_160T05_9000003580cztM0_level2_quad_clean.evt |
| Size (bytes) | 1,847,367,360 | 708,580,800 |
| Size | 1.7 GB | 675.8 MB |
| Events in quadrant A | 10,906,594 | 4,696,444 |
| Events in quadrant B | 10,847,604 | 4,729,291 |
| Events in quadrant C | 13,858,239 | 4,350,146 |
| Events in quadrant D | 16,966,059 | 4,296,039 |
| Mode SS | |||
|---|---|---|---|
| Quadrant | BADHDUFLAG | Total packets | Discarded packets |
| A | 0 | 1006 | 0 |
| B | 0 | 1006 | 0 |
| C | 0 | 1006 | 0 |
| D | 0 | 1006 | 0 |
| Mode M9 | |||
|---|---|---|---|
| Quadrant | BADHDUFLAG | Total packets | Discarded packets |
| A | 0 | 81 | 0 |
| B | 0 | 81 | 0 |
| C | 0 | 81 | 0 |
| D | 0 | 81 | 0 |
| Mode M0 | |||
|---|---|---|---|
| Quadrant | BADHDUFLAG | Total packets | Discarded packets |
| A | 0 | 102949 | 0 |
| B | 0 | 103047 | 0 |
| C | 0 | 114361 | 0 |
| D | 0 | 120767 | 0 |
| Quadrant | Total seconds | Saturated seconds | Saturation percentage |
|---|---|---|---|
| A | 49426 | 744 | 1.505281% |
| B | 49426 | 834 | 1.687371% |
| C | 49426 | 1852 | 3.747016% |
| D | 49426 | 1005 | 2.033343% |
Noise dominated data is calculated using 1-second bins in cleaned event files. If a bin has >2000 counts, and if more than 50% of those come from <1% of pixels, then it is considered to be noise-dominated and hence unusable.
| Quadrant | # 1 sec bins | Bins with >0 counts | Bins with >2000 counts | High rate bins dominated by noise | Noise dominated (total time) | Noise dominated (detector-on time) | Marked lightcurve |
|---|---|---|---|---|---|---|---|
| A | 57486 | 49423 | 16 | 16 | 0.03% | 0.03% |  |
| B | 57486 | 49421 | 1 | 1 | 0.00% | 0.00% |  |
| C | 57486 | 49423 | 115 | 115 | 0.20% | 0.23% |  |
| D | 57486 | 49425 | 110 | 110 | 0.19% | 0.22% |  |
Top three noisy pixels from each quadrant. If the there are fewer than three noisy pixels in the level2.evt file, extra rows are filled as -1
| Pixel properties | Quadrant properties | ||||||
|---|---|---|---|---|---|---|---|
| Quadrant | DetID | PixID | Counts | Sigma | Mean | Median | Sigma |
| A | 6 | 16 | 140866 | 231.53 | 2777 | 2737 | 596.6 |
| A | 13 | 254 | 74579 | 120.42 | 2777 | 2737 | 596.6 |
| A | 3 | 1 | 44628 | 70.22 | 2777 | 2737 | 596.6 |
| B | 0 | 230 | 44568 | 81.05 | 2792 | 2734 | 516.2 |
| B | 4 | 216 | 33316 | 59.25 | 2792 | 2734 | 516.2 |
| B | 0 | 245 | 25417 | 43.95 | 2792 | 2734 | 516.2 |
| C | 2 | 16 | 2005050 | 3290.53 | 2597 | 2588 | 608.6 |
| C | 7 | 247 | 1841790 | 3022.25 | 2597 | 2588 | 608.6 |
| C | 3 | 233 | 35348 | 53.83 | 2597 | 2588 | 608.6 |
| D | 8 | 195 | 4594160 | 7462.71 | 2665 | 2580 | 615.3 |
| D | 7 | 238 | 1142454 | 1852.64 | 2665 | 2580 | 615.3 |
| D | 1 | 52 | 395953 | 639.35 | 2665 | 2580 | 615.3 |
Histogram calculated using DETX and DETY for each event in the final _common_clean file
| Quadrant A |  |
 |
Quadrant B |
|---|---|---|---|
| Quadrant D | 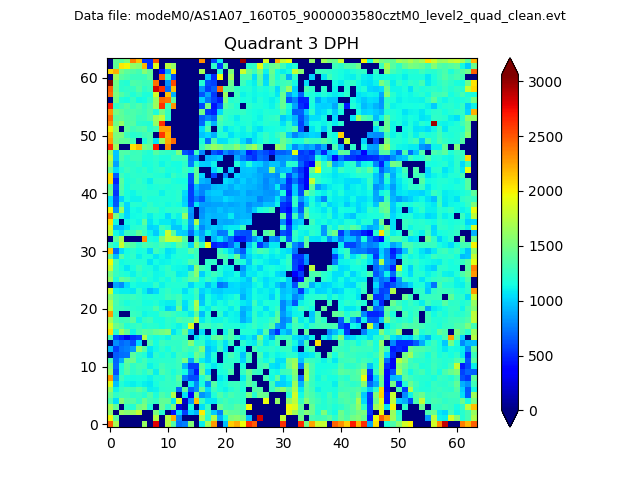 |
 |
Quadrant C |
| Plot type | Count rate plots | Images |
|---|---|---|
| Comparison with Poisson distribution Blue bars denote a histogram of data divided into 1 sec bins. Red curve is a Poisson curve with rate = median count rate of data. |
 |
 |
| Quadrant-wise count rates Data is divided into 100 sec bins |
 |
|
| Module-wise count rates for Quadrant A Data is divided into 100 sec bins |
 |
 |
| Module-wise count rates for Quadrant B Data is divided into 100 sec bins |
 |
 |
| Module-wise count rates for Quadrant C Data is divided into 100 sec bins |
 |
 |
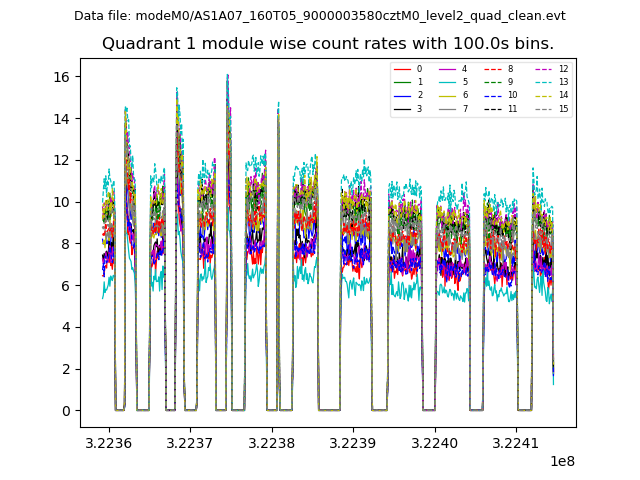
| Module-wise count rates for Quadrant D Data is divided into 100 sec bins |
 |
 |
| Parameter | Plot |
|---|---|
| CZT HV Monitor |  |
| D_VDD | 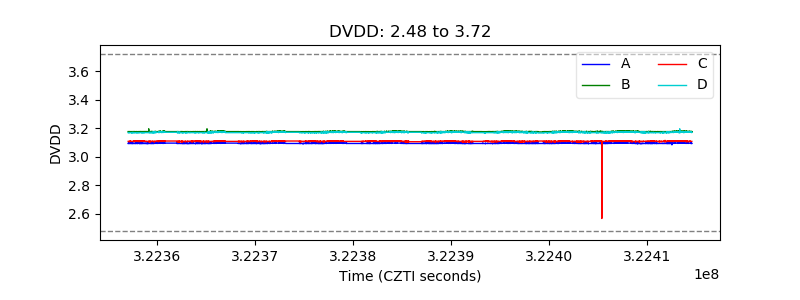 |
| Temperature 1 |  |
| Veto HV Monitor |  |
| Veto LLD | 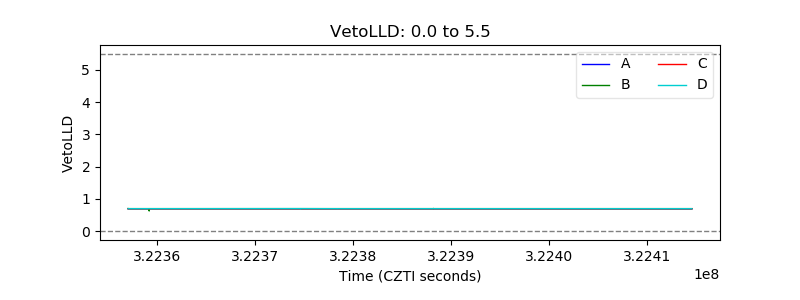 |
| Alpha Counter | 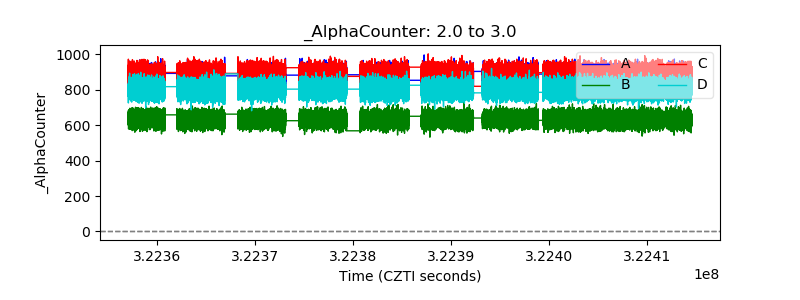 |
| _CPM_Rate |  |
| CZT Counter |  |
| +2.5 Volts monitor |  |
| +5 Volts monitor |  |
| _ROLL_ROT |  |
| _Roll_DEC |  |
| _Roll_RA |  |
| Veto Counter |  |