| Param | Original file | Final file |
|---|---|---|
| Filename | modeM0/AS1A07_067T01_9000003578cztM0_level2_bc.evt | modeM0/AS1A07_067T01_9000003578cztM0_level2_quad_clean.evt |
| Size (bytes) | 7,896,784,320 | 2,324,975,040 |
| Size | 7.4 GB | 2.2 GB |
| Events in quadrant A | 37,806,058 | 15,068,978 |
| Events in quadrant B | 38,135,540 | 15,326,101 |
| Events in quadrant C | 44,530,976 | 14,643,693 |
| Events in quadrant D | 106,606,017 | 13,227,813 |
| Mode M9 | |||
|---|---|---|---|
| Quadrant | BADHDUFLAG | Total packets | Discarded packets |
| A | 0 | 277 | 0 |
| B | 0 | 278 | 0 |
| C | 0 | 278 | 0 |
| D | 0 | 278 | 0 |
| Mode SS | |||
|---|---|---|---|
| Quadrant | BADHDUFLAG | Total packets | Discarded packets |
| A | 0 | 3618 | 0 |
| B | 0 | 3618 | 0 |
| C | 0 | 3618 | 0 |
| D | 0 | 3618 | 0 |
| Mode M0 | |||
|---|---|---|---|
| Quadrant | BADHDUFLAG | Total packets | Discarded packets |
| A | 0 | 367134 | 0 |
| B | 0 | 368872 | 0 |
| C | 0 | 394216 | 0 |
| D | 0 | 661640 | 0 |
| Quadrant | Total seconds | Saturated seconds | Saturation percentage |
|---|---|---|---|
| A | 177355 | 2136 | 1.204364% |
| B | 177354 | 2568 | 1.447952% |
| C | 177354 | 4850 | 2.734644% |
| D | 177354 | 35984 | 20.289365% |
Noise dominated data is calculated using 1-second bins in cleaned event files. If a bin has >2000 counts, and if more than 50% of those come from <1% of pixels, then it is considered to be noise-dominated and hence unusable.
| Quadrant | # 1 sec bins | Bins with >0 counts | Bins with >2000 counts | High rate bins dominated by noise | Noise dominated (total time) | Noise dominated (detector-on time) | Marked lightcurve |
|---|---|---|---|---|---|---|---|
| A | 226289 | 177352 | 33 | 33 | 0.01% | 0.02% |  |
| B | 226289 | 177342 | 59 | 59 | 0.03% | 0.03% | 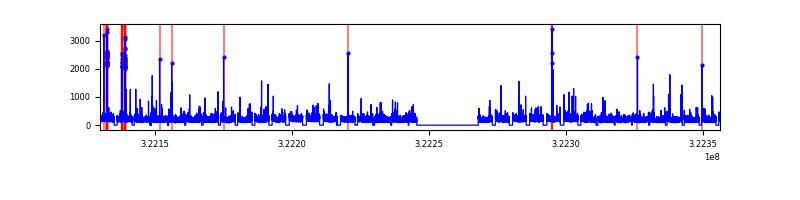 |
| C | 226290 | 177346 | 423 | 423 | 0.19% | 0.24% |  |
| D | 226289 | 177340 | 2751 | 2751 | 1.22% | 1.55% | 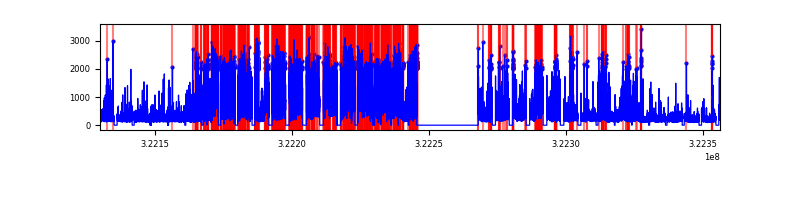 |
Top three noisy pixels from each quadrant. If the there are fewer than three noisy pixels in the level2.evt file, extra rows are filled as -1
| Pixel properties | Quadrant properties | ||||||
|---|---|---|---|---|---|---|---|
| Quadrant | DetID | PixID | Counts | Sigma | Mean | Median | Sigma |
| A | 6 | 16 | 386864 | 181.83 | 9662 | 9510 | 2075.3 |
| A | 13 | 254 | 263279 | 122.28 | 9662 | 9510 | 2075.3 |
| A | 3 | 1 | 119207 | 52.86 | 9662 | 9510 | 2075.3 |
| B | 0 | 245 | 202916 | 106.17 | 9733 | 9500 | 1821.7 |
| B | 0 | 190 | 139159 | 71.17 | 9733 | 9500 | 1821.7 |
| B | 4 | 216 | 119224 | 60.23 | 9733 | 9500 | 1821.7 |
| C | 2 | 16 | 4014279 | 1855.43 | 9230 | 9204 | 2158.6 |
| C | 0 | 239 | 2422098 | 1117.82 | 9230 | 9204 | 2158.6 |
| C | 7 | 247 | 2004416 | 924.32 | 9230 | 9204 | 2158.6 |
| D | 7 | 238 | 56932667 | 28140.38 | 8628 | 8327 | 2022.9 |
| D | 8 | 195 | 5961602 | 2942.98 | 8628 | 8327 | 2022.9 |
| D | 12 | 218 | 5315930 | 2623.8 | 8628 | 8327 | 2022.9 |
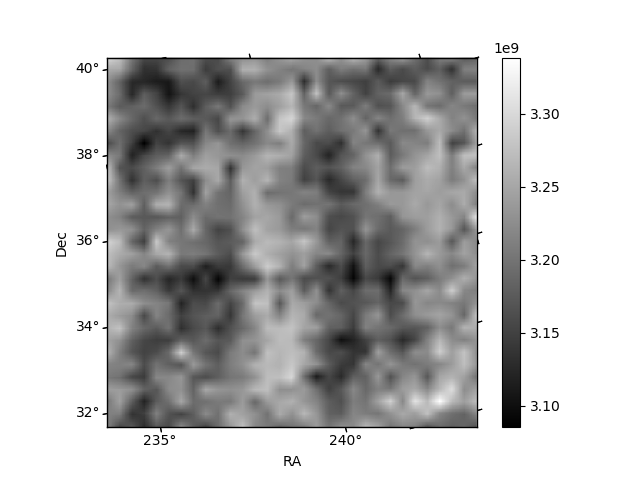
Histogram calculated using DETX and DETY for each event in the final _common_clean file
| Quadrant A |  |
 |
Quadrant B |
|---|---|---|---|
| Quadrant D | 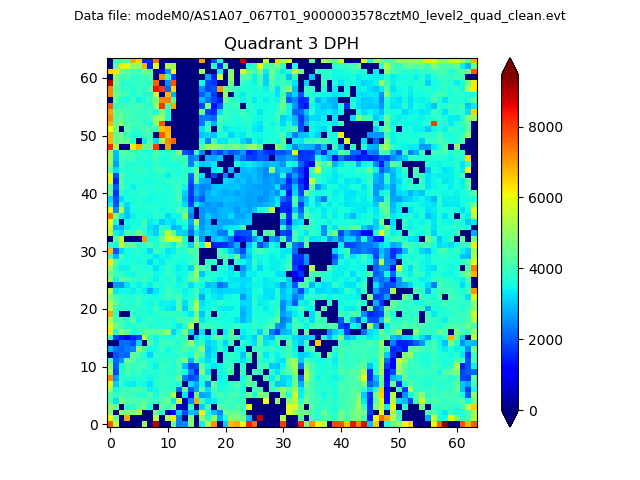 |
 |
Quadrant C |
| Plot type | Count rate plots | Images |
|---|---|---|
| Comparison with Poisson distribution Blue bars denote a histogram of data divided into 1 sec bins. Red curve is a Poisson curve with rate = median count rate of data. |
 |
 |
| Quadrant-wise count rates Data is divided into 100 sec bins |
 |
|
| Module-wise count rates for Quadrant A Data is divided into 100 sec bins |
 |
 |
| Module-wise count rates for Quadrant B Data is divided into 100 sec bins |
 |
 |
| Module-wise count rates for Quadrant C Data is divided into 100 sec bins |
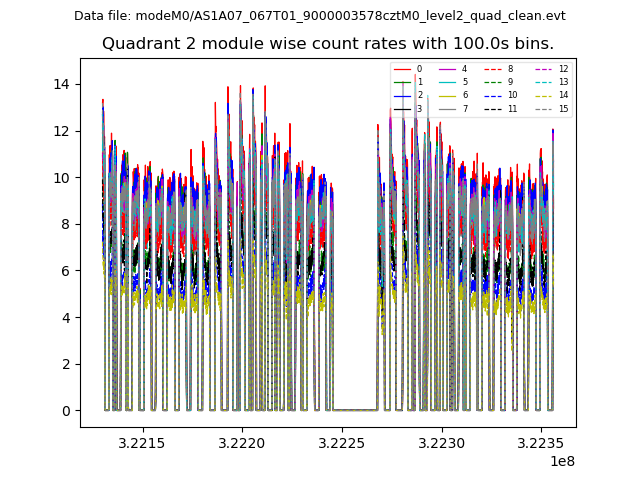 |
 |
| Module-wise count rates for Quadrant D Data is divided into 100 sec bins |
 |
 |
| Parameter | Plot |
|---|---|
| CZT HV Monitor |  |
| D_VDD |  |
| Temperature 1 |  |
| Veto HV Monitor | 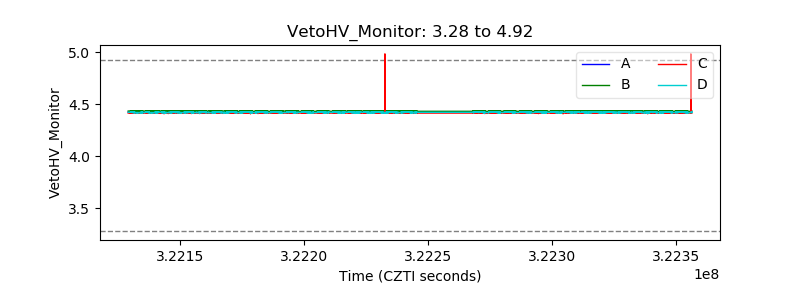 |
| Veto LLD |  |
| Alpha Counter |  |
| _CPM_Rate | 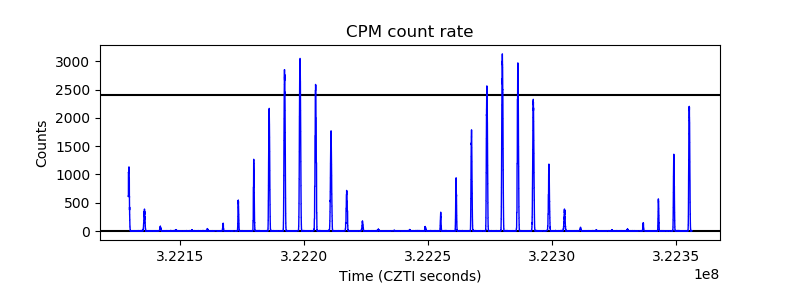 |
| CZT Counter |  |
| +2.5 Volts monitor | 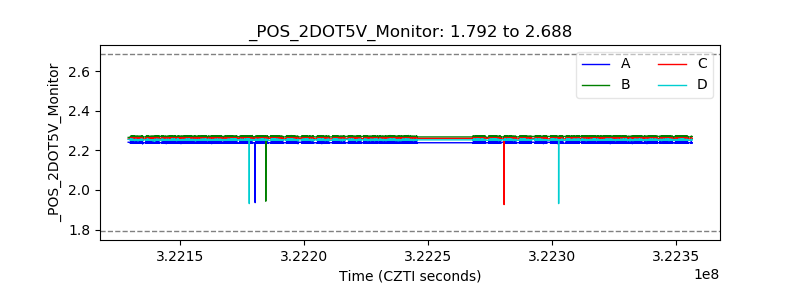 |
| +5 Volts monitor |  |
| _ROLL_ROT |  |
| _Roll_DEC | 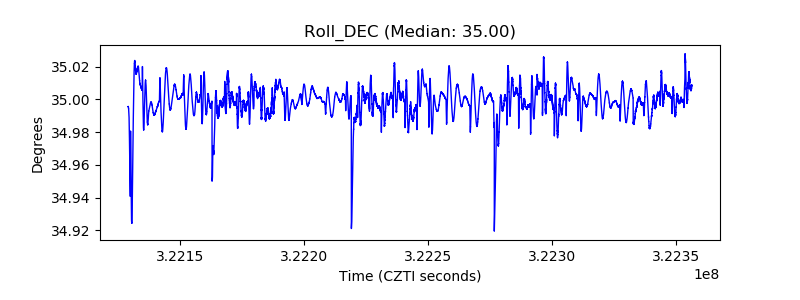 |
| _Roll_RA |  |
| Veto Counter |  |