| Param | Original file | Final file |
|---|---|---|
| Filename | modeM0/AS1A07_047T06_9000003576cztM0_level2_bc.evt | modeM0/AS1A07_047T06_9000003576cztM0_level2_quad_clean.evt |
| Size (bytes) | 1,356,379,200 | 738,002,880 |
| Size | 1.3 GB | 703.8 MB |
| Events in quadrant A | 7,964,193 | 5,109,369 |
| Events in quadrant B | 8,548,027 | 5,143,066 |
| Events in quadrant C | 8,990,309 | 4,871,411 |
| Events in quadrant D | 13,149,894 | 4,790,350 |
| Mode M9 | |||
|---|---|---|---|
| Quadrant | BADHDUFLAG | Total packets | Discarded packets |
| A | 0 | 65 | 0 |
| B | 0 | 65 | 0 |
| C | 0 | 65 | 0 |
| D | 0 | 65 | 0 |
| Mode SS | |||
|---|---|---|---|
| Quadrant | BADHDUFLAG | Total packets | Discarded packets |
| A | 0 | 726 | 0 |
| B | 0 | 726 | 0 |
| C | 0 | 726 | 0 |
| D | 0 | 726 | 0 |
| Mode M0 | |||
|---|---|---|---|
| Quadrant | BADHDUFLAG | Total packets | Discarded packets |
| A | 0 | 74273 | 0 |
| B | 0 | 76870 | 0 |
| C | 0 | 79436 | 0 |
| D | 0 | 91826 | 0 |
| Quadrant | Total seconds | Saturated seconds | Saturation percentage |
|---|---|---|---|
| A | 35548 | 233 | 0.655452% |
| B | 35548 | 483 | 1.358726% |
| C | 35548 | 712 | 2.002926% |
| D | 35548 | 918 | 2.582424% |
Noise dominated data is calculated using 1-second bins in cleaned event files. If a bin has >2000 counts, and if more than 50% of those come from <1% of pixels, then it is considered to be noise-dominated and hence unusable.
| Quadrant | # 1 sec bins | Bins with >0 counts | Bins with >2000 counts | High rate bins dominated by noise | Noise dominated (total time) | Noise dominated (detector-on time) | Marked lightcurve |
|---|---|---|---|---|---|---|---|
| A | 46538 | 35543 | 0 | 0 | 0.00% | 0.00% |  |
| B | 46538 | 35543 | 35 | 35 | 0.08% | 0.10% | 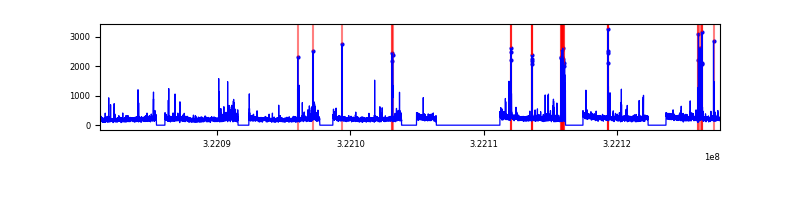 |
| C | 46538 | 35545 | 92 | 92 | 0.20% | 0.26% |  |
| D | 46538 | 35543 | 141 | 141 | 0.30% | 0.40% |  |
Top three noisy pixels from each quadrant. If the there are fewer than three noisy pixels in the level2.evt file, extra rows are filled as -1
| Pixel properties | Quadrant properties | ||||||
|---|---|---|---|---|---|---|---|
| Quadrant | DetID | PixID | Counts | Sigma | Mean | Median | Sigma |
| A | 13 | 254 | 58946 | 129.34 | 2057 | 2027 | 440.1 |
| A | 6 | 16 | 18457 | 37.34 | 2057 | 2027 | 440.1 |
| A | 0 | 226 | 13609 | 26.32 | 2057 | 2027 | 440.1 |
| B | 0 | 245 | 303309 | 785.57 | 2057 | 2018 | 383.5 |
| B | 4 | 216 | 86521 | 220.33 | 2057 | 2018 | 383.5 |
| B | 0 | 189 | 80530 | 204.71 | 2057 | 2018 | 383.5 |
| C | 10 | 9 | 510396 | 1113.22 | 1959 | 1960 | 456.7 |
| C | 2 | 16 | 437497 | 953.61 | 1959 | 1960 | 456.7 |
| C | 0 | 207 | 201161 | 436.15 | 1959 | 1960 | 456.7 |
| D | 7 | 238 | 3893002 | 8316.05 | 2009 | 1945 | 467.9 |
| D | 8 | 195 | 876871 | 1869.91 | 2009 | 1945 | 467.9 |
| D | 1 | 52 | 292839 | 621.7 | 2009 | 1945 | 467.9 |
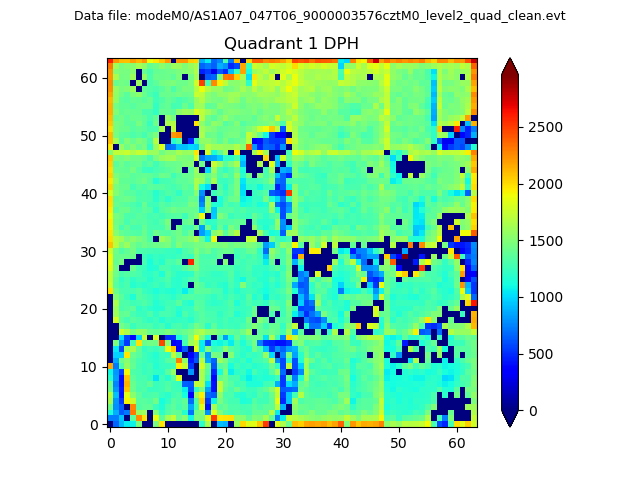
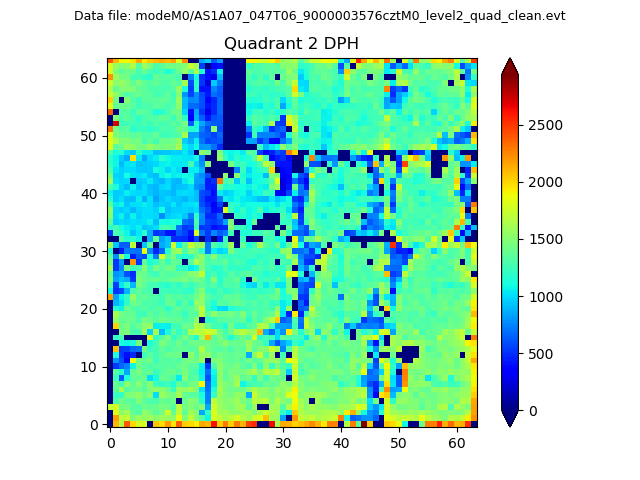
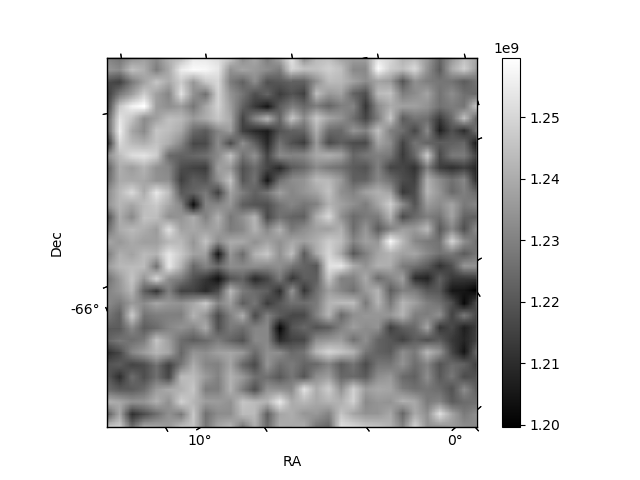
Histogram calculated using DETX and DETY for each event in the final _common_clean file
| Quadrant A |  |
 |
Quadrant B |
|---|---|---|---|
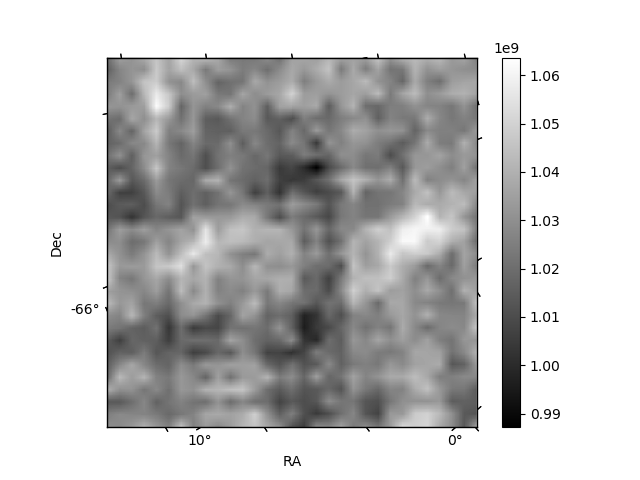
| Quadrant D | 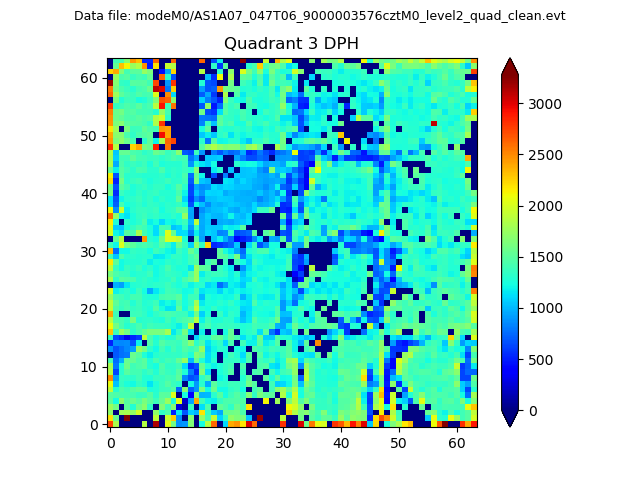 |
 |
Quadrant C |
| Plot type | Count rate plots | Images |
|---|---|---|
| Comparison with Poisson distribution Blue bars denote a histogram of data divided into 1 sec bins. Red curve is a Poisson curve with rate = median count rate of data. |
 |
 |
| Quadrant-wise count rates Data is divided into 100 sec bins |
 |
|
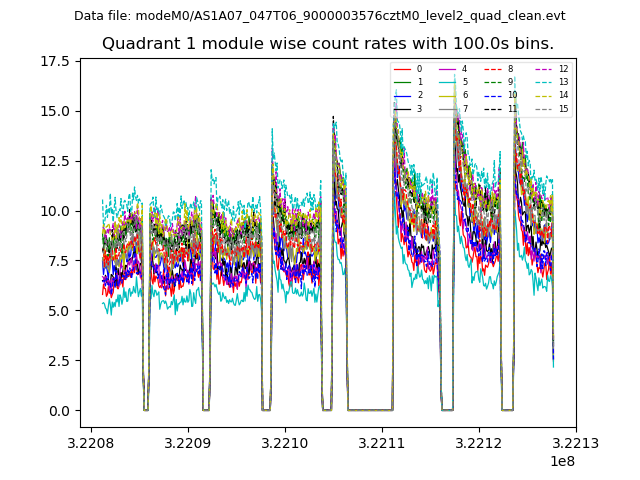
| Module-wise count rates for Quadrant A Data is divided into 100 sec bins |
 |
 |
| Module-wise count rates for Quadrant B Data is divided into 100 sec bins |
 |
 |
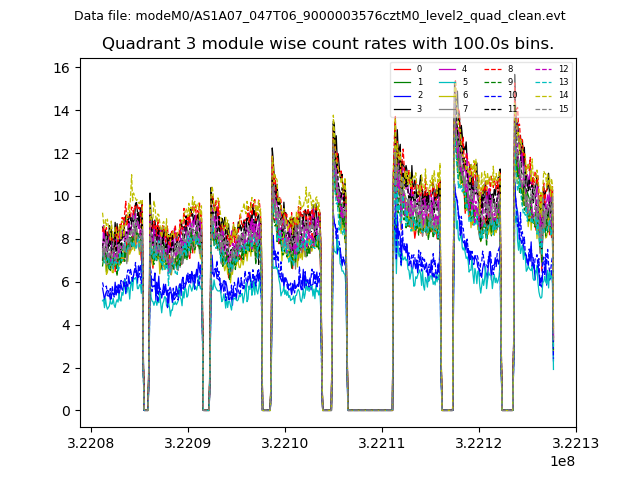
| Module-wise count rates for Quadrant C Data is divided into 100 sec bins |
 |
 |
| Module-wise count rates for Quadrant D Data is divided into 100 sec bins |
 |
 |
| Parameter | Plot |
|---|---|
| CZT HV Monitor | 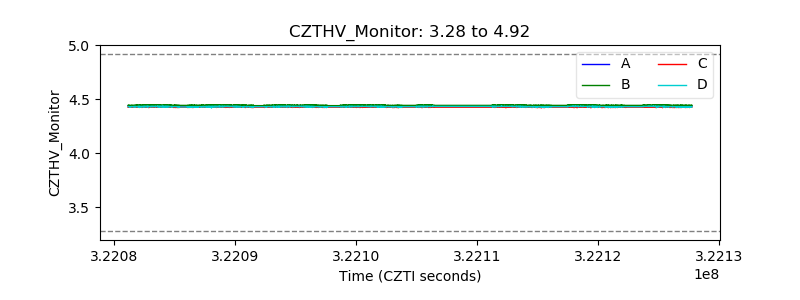 |
| D_VDD |  |
| Temperature 1 |  |
| Veto HV Monitor |  |
| Veto LLD |  |
| Alpha Counter |  |
| _CPM_Rate | 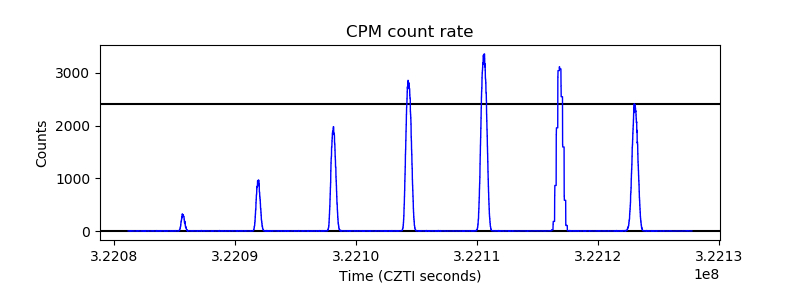 |
| CZT Counter |  |
| +2.5 Volts monitor |  |
| +5 Volts monitor |  |
| _ROLL_ROT |  |
| _Roll_DEC | 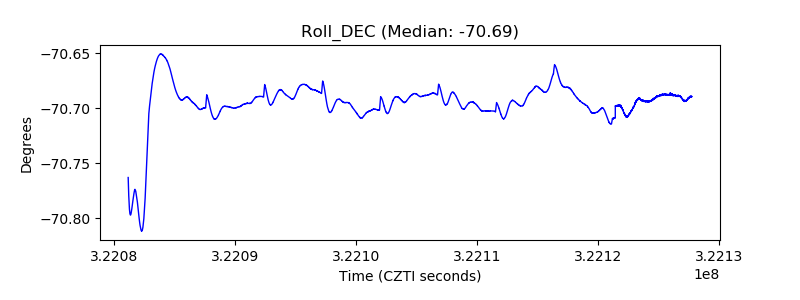 |
| _Roll_RA |  |
| Veto Counter |  |