| Param | Original file | Final file |
|---|---|---|
| Filename | modeM0/AS1A07_047T01_9000003572cztM0_level2_bc.evt | modeM0/AS1A07_047T01_9000003572cztM0_level2_quad_clean.evt |
| Size (bytes) | 527,209,920 | 299,188,800 |
| Size | 502.8 MB | 285.3 MB |
| Events in quadrant A | 3,275,377 | 2,072,854 |
| Events in quadrant B | 3,416,259 | 2,078,275 |
| Events in quadrant C | 3,376,907 | 1,944,187 |
| Events in quadrant D | 4,869,515 | 1,932,811 |
| Mode SS | |||
|---|---|---|---|
| Quadrant | BADHDUFLAG | Total packets | Discarded packets |
| A | 0 | 306 | 0 |
| B | 0 | 306 | 0 |
| C | 0 | 306 | 0 |
| D | 0 | 306 | 0 |
| Mode M9 | |||
|---|---|---|---|
| Quadrant | BADHDUFLAG | Total packets | Discarded packets |
| A | 0 | 27 | 0 |
| B | 0 | 27 | 0 |
| C | 0 | 27 | 0 |
| D | 0 | 27 | 0 |
| Mode M0 | |||
|---|---|---|---|
| Quadrant | BADHDUFLAG | Total packets | Discarded packets |
| A | 0 | 31012 | 0 |
| B | 0 | 31462 | 0 |
| C | 0 | 32341 | 0 |
| D | 0 | 35718 | 0 |
| Quadrant | Total seconds | Saturated seconds | Saturation percentage |
|---|---|---|---|
| A | 14996 | 198 | 1.320352% |
| B | 14996 | 207 | 1.380368% |
| C | 14996 | 390 | 2.600694% |
| D | 14996 | 369 | 2.460656% |
Noise dominated data is calculated using 1-second bins in cleaned event files. If a bin has >2000 counts, and if more than 50% of those come from <1% of pixels, then it is considered to be noise-dominated and hence unusable.
| Quadrant | # 1 sec bins | Bins with >0 counts | Bins with >2000 counts | High rate bins dominated by noise | Noise dominated (total time) | Noise dominated (detector-on time) | Marked lightcurve |
|---|---|---|---|---|---|---|---|
| A | 17691 | 14995 | 0 | 0 | 0.00% | 0.00% |  |
| B | 17691 | 14995 | 22 | 22 | 0.12% | 0.15% | 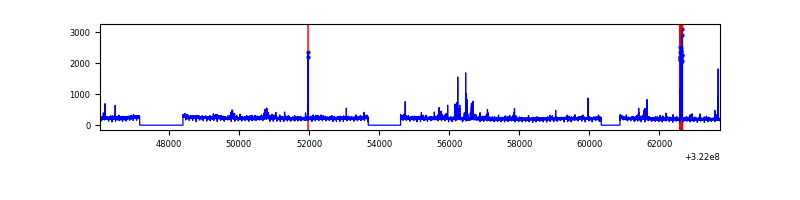 |
| C | 17691 | 14995 | 14 | 14 | 0.08% | 0.09% |  |
| D | 17691 | 14996 | 70 | 70 | 0.40% | 0.47% |  |
Top three noisy pixels from each quadrant. If the there are fewer than three noisy pixels in the level2.evt file, extra rows are filled as -1
| Pixel properties | Quadrant properties | ||||||
|---|---|---|---|---|---|---|---|
| Quadrant | DetID | PixID | Counts | Sigma | Mean | Median | Sigma |
| A | 3 | 1 | 60437 | 331.21 | 830 | 818 | 180.0 |
| A | 13 | 254 | 22994 | 123.2 | 830 | 818 | 180.0 |
| A | 2 | 79 | 8491 | 42.63 | 830 | 818 | 180.0 |
| B | 0 | 189 | 98692 | 616.49 | 829 | 813 | 158.8 |
| B | 0 | 245 | 66318 | 412.58 | 829 | 813 | 158.8 |
| B | 4 | 52 | 20166 | 121.89 | 829 | 813 | 158.8 |
| C | 2 | 16 | 256387 | 1397.24 | 772 | 769 | 182.9 |
| C | 0 | 207 | 71199 | 384.98 | 772 | 769 | 182.9 |
| C | 0 | 239 | 49556 | 266.68 | 772 | 769 | 182.9 |
| D | 8 | 195 | 610530 | 3190.53 | 802 | 775 | 191.1 |
| D | 1 | 52 | 577422 | 3017.3 | 802 | 775 | 191.1 |
| D | 7 | 238 | 415701 | 2171.09 | 802 | 775 | 191.1 |
Histogram calculated using DETX and DETY for each event in the final _common_clean file
| Quadrant A |  |
 |
Quadrant B |
|---|---|---|---|
| Quadrant D |  |
 |
Quadrant C |
| Plot type | Count rate plots | Images |
|---|---|---|
| Comparison with Poisson distribution Blue bars denote a histogram of data divided into 1 sec bins. Red curve is a Poisson curve with rate = median count rate of data. |
 |
 |
| Quadrant-wise count rates Data is divided into 100 sec bins |
 |
|
| Module-wise count rates for Quadrant A Data is divided into 100 sec bins |
 |
 |
| Module-wise count rates for Quadrant B Data is divided into 100 sec bins |
 |
 |
| Module-wise count rates for Quadrant C Data is divided into 100 sec bins |
 |
 |
| Module-wise count rates for Quadrant D Data is divided into 100 sec bins |
 |
 |
| Parameter | Plot |
|---|---|
| CZT HV Monitor |  |
| D_VDD |  |
| Temperature 1 |  |
| Veto HV Monitor |  |
| Veto LLD |  |
| Alpha Counter |  |
| _CPM_Rate |  |
| CZT Counter |  |
| +2.5 Volts monitor |  |
| +5 Volts monitor |  |
| _ROLL_ROT |  |
| _Roll_DEC |  |
| _Roll_RA |  |
| Veto Counter |  |