| Param | Original file | Final file |
|---|---|---|
| Filename | modeM0/AS1C05_002T09_9000003566cztM0_level2_bc.evt | modeM0/AS1C05_002T09_9000003566cztM0_level2_quad_clean.evt |
| Size (bytes) | 288,060,480 | 114,644,160 |
| Size | 274.7 MB | 109.3 MB |
| Events in quadrant A | 1,502,575 | 754,871 |
| Events in quadrant B | 1,531,192 | 758,233 |
| Events in quadrant C | 1,464,189 | 733,469 |
| Events in quadrant D | 3,711,572 | 708,020 |
| Mode M9 | |||
|---|---|---|---|
| Quadrant | BADHDUFLAG | Total packets | Discarded packets |
| A | 0 | 5 | 0 |
| B | 0 | 5 | 0 |
| C | 0 | 5 | 0 |
| D | 0 | 5 | 0 |
| Mode M0 | |||
|---|---|---|---|
| Quadrant | BADHDUFLAG | Total packets | Discarded packets |
| A | 0 | 15196 | 0 |
| B | 0 | 15276 | 0 |
| C | 0 | 15164 | 0 |
| D | 0 | 22321 | 0 |
| Mode SS | |||
|---|---|---|---|
| Quadrant | BADHDUFLAG | Total packets | Discarded packets |
| A | 0 | 152 | 0 |
| B | 0 | 152 | 0 |
| C | 0 | 152 | 0 |
| D | 0 | 152 | 0 |
| Quadrant | Total seconds | Saturated seconds | Saturation percentage |
|---|---|---|---|
| A | 7433 | 82 | 1.103188% |
| B | 7433 | 105 | 1.412619% |
| C | 7433 | 132 | 1.775864% |
| D | 7433 | 619 | 8.327728% |
Noise dominated data is calculated using 1-second bins in cleaned event files. If a bin has >2000 counts, and if more than 50% of those come from <1% of pixels, then it is considered to be noise-dominated and hence unusable.
| Quadrant | # 1 sec bins | Bins with >0 counts | Bins with >2000 counts | High rate bins dominated by noise | Noise dominated (total time) | Noise dominated (detector-on time) | Marked lightcurve |
|---|---|---|---|---|---|---|---|
| A | 7993 | 7433 | 0 | 0 | 0.00% | 0.00% |  |
| B | 7993 | 7433 | 1 | 1 | 0.01% | 0.01% |  |
| C | 7993 | 7433 | 0 | 0 | 0.00% | 0.00% |  |
| D | 7993 | 7432 | 233 | 233 | 2.92% | 3.14% |  |
Top three noisy pixels from each quadrant. If the there are fewer than three noisy pixels in the level2.evt file, extra rows are filled as -1
| Pixel properties | Quadrant properties | ||||||
|---|---|---|---|---|---|---|---|
| Quadrant | DetID | PixID | Counts | Sigma | Mean | Median | Sigma |
| A | 4 | 2 | 19101 | 217.49 | 383 | 375 | 86.1 |
| A | 13 | 254 | 10571 | 118.42 | 383 | 375 | 86.1 |
| A | 3 | 1 | 2641 | 26.32 | 383 | 375 | 86.1 |
| B | 10 | 247 | 16886 | 217.25 | 384 | 374 | 76.0 |
| B | 4 | 187 | 13596 | 173.96 | 384 | 374 | 76.0 |
| B | 4 | 171 | 8204 | 103.02 | 384 | 374 | 76.0 |
| C | 7 | 247 | 38580 | 425.3 | 368 | 365 | 89.9 |
| C | 3 | 233 | 4796 | 49.31 | 368 | 365 | 89.9 |
| C | 10 | 9 | 4749 | 48.79 | 368 | 365 | 89.9 |
| D | 1 | 52 | 649805 | 7239.66 | 368 | 353 | 89.7 |
| D | 7 | 238 | 581592 | 6479.27 | 368 | 353 | 89.7 |
| D | 8 | 195 | 550302 | 6130.47 | 368 | 353 | 89.7 |
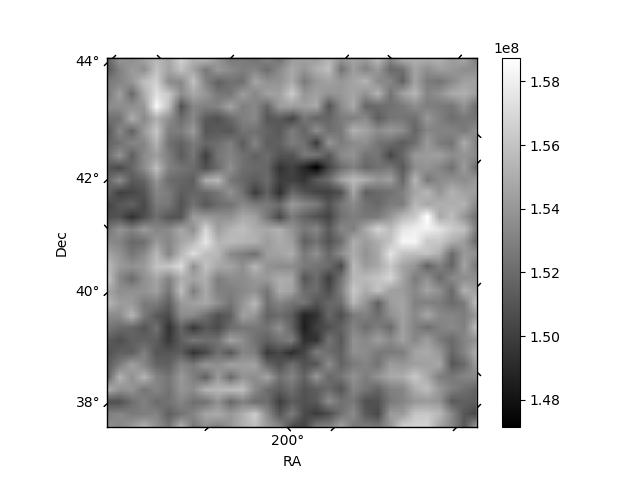
Histogram calculated using DETX and DETY for each event in the final _common_clean file
| Quadrant A |  |
 |
Quadrant B |
|---|---|---|---|
| Quadrant D |  |
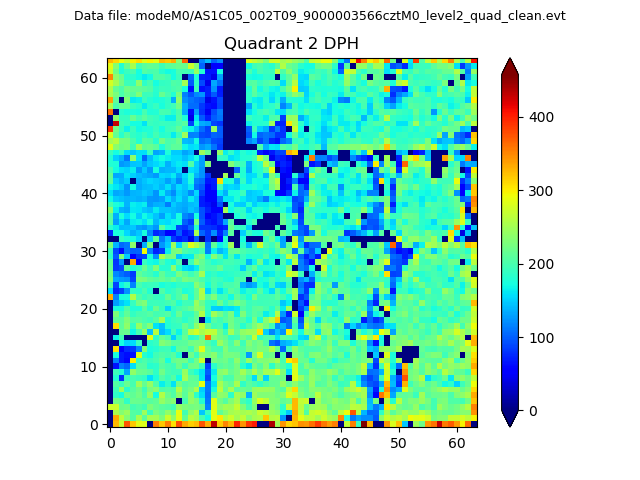 |
Quadrant C |
| Plot type | Count rate plots | Images |
|---|---|---|
| Comparison with Poisson distribution Blue bars denote a histogram of data divided into 1 sec bins. Red curve is a Poisson curve with rate = median count rate of data. |
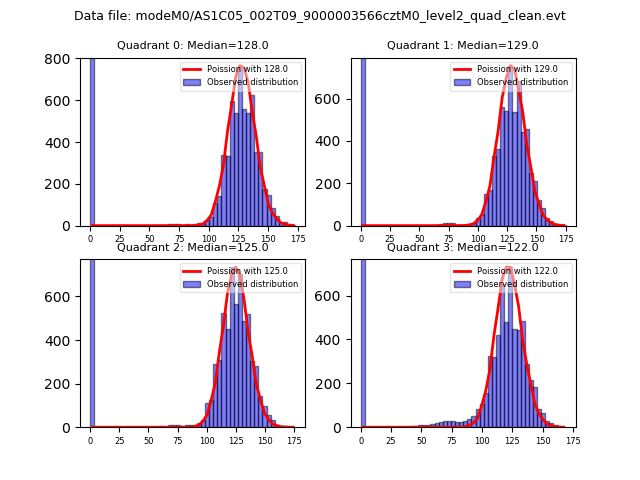 |
 |
| Quadrant-wise count rates Data is divided into 100 sec bins |
 |
|
| Module-wise count rates for Quadrant A Data is divided into 100 sec bins |
 |
 |
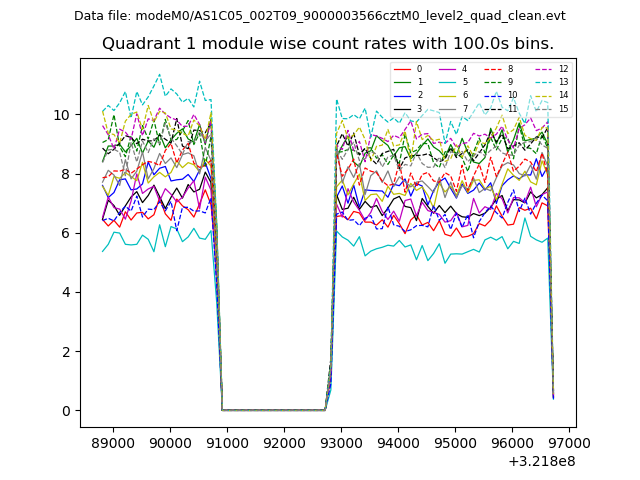
| Module-wise count rates for Quadrant B Data is divided into 100 sec bins |
 |
 |
| Module-wise count rates for Quadrant C Data is divided into 100 sec bins |
 |
 |
| Module-wise count rates for Quadrant D Data is divided into 100 sec bins |
 |
 |
| Parameter | Plot |
|---|---|
| CZT HV Monitor |  |
| D_VDD |  |
| Temperature 1 |  |
| Veto HV Monitor | 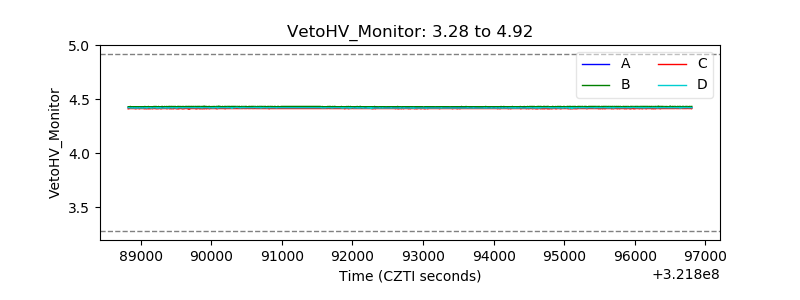 |
| Veto LLD |  |
| Alpha Counter |  |
| _CPM_Rate |  |
| CZT Counter |  |
| +2.5 Volts monitor |  |
| +5 Volts monitor |  |
| _ROLL_ROT |  |
| _Roll_DEC |  |
| _Roll_RA |  |
| Veto Counter |  |