| Param | Original file | Final file |
|---|---|---|
| Filename | modeM0/AS1A07_134T02_9000003568cztM0_level2_bc.evt | modeM0/AS1A07_134T02_9000003568cztM0_level2_quad_clean.evt |
| Size (bytes) | 832,872,960 | 304,718,400 |
| Size | 794.3 MB | 290.6 MB |
| Events in quadrant A | 4,858,279 | 1,929,743 |
| Events in quadrant B | 5,166,738 | 1,951,292 |
| Events in quadrant C | 4,865,122 | 1,876,134 |
| Events in quadrant D | 8,687,324 | 1,815,830 |
| Mode M9 | |||
|---|---|---|---|
| Quadrant | BADHDUFLAG | Total packets | Discarded packets |
| A | 0 | 22 | 0 |
| B | 0 | 22 | 0 |
| C | 0 | 22 | 0 |
| D | 0 | 22 | 0 |
| Mode SS | |||
|---|---|---|---|
| Quadrant | BADHDUFLAG | Total packets | Discarded packets |
| A | 0 | 490 | 0 |
| B | 0 | 490 | 0 |
| C | 0 | 490 | 0 |
| D | 0 | 490 | 0 |
| Mode M0 | |||
|---|---|---|---|
| Quadrant | BADHDUFLAG | Total packets | Discarded packets |
| A | 0 | 49736 | 0 |
| B | 0 | 50734 | 0 |
| C | 0 | 50207 | 0 |
| D | 0 | 61972 | 0 |
| Quadrant | Total seconds | Saturated seconds | Saturation percentage |
|---|---|---|---|
| A | 24069 | 203 | 0.843409% |
| B | 24069 | 286 | 1.188250% |
| C | 24069 | 351 | 1.458307% |
| D | 24069 | 479 | 1.990112% |
Noise dominated data is calculated using 1-second bins in cleaned event files. If a bin has >2000 counts, and if more than 50% of those come from <1% of pixels, then it is considered to be noise-dominated and hence unusable.
| Quadrant | # 1 sec bins | Bins with >0 counts | Bins with >2000 counts | High rate bins dominated by noise | Noise dominated (total time) | Noise dominated (detector-on time) | Marked lightcurve |
|---|---|---|---|---|---|---|---|
| A | 26269 | 24068 | 0 | 0 | 0.00% | 0.00% |  |
| B | 26269 | 24069 | 4 | 4 | 0.02% | 0.02% |  |
| C | 26269 | 24069 | 2 | 2 | 0.01% | 0.01% |  |
| D | 26269 | 24069 | 89 | 89 | 0.34% | 0.37% | 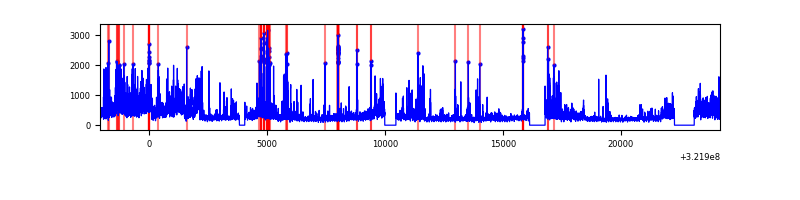 |
Top three noisy pixels from each quadrant. If the there are fewer than three noisy pixels in the level2.evt file, extra rows are filled as -1
| Pixel properties | Quadrant properties | ||||||
|---|---|---|---|---|---|---|---|
| Quadrant | DetID | PixID | Counts | Sigma | Mean | Median | Sigma |
| A | 3 | 1 | 91105 | 331.57 | 1227 | 1197 | 271.2 |
| A | 13 | 254 | 35831 | 127.73 | 1227 | 1197 | 271.2 |
| A | 2 | 250 | 28700 | 101.43 | 1227 | 1197 | 271.2 |
| B | 0 | 189 | 66171 | 273.82 | 1235 | 1203 | 237.3 |
| B | 4 | 171 | 64009 | 264.7 | 1235 | 1203 | 237.3 |
| B | 0 | 190 | 60934 | 251.74 | 1235 | 1203 | 237.3 |
| C | 7 | 247 | 159539 | 561.44 | 1183 | 1171 | 282.1 |
| C | 10 | 9 | 106165 | 372.22 | 1183 | 1171 | 282.1 |
| C | 3 | 233 | 46163 | 159.5 | 1183 | 1171 | 282.1 |
| D | 8 | 195 | 1870795 | 6426.21 | 1208 | 1160 | 290.9 |
| D | 1 | 52 | 1209985 | 4154.91 | 1208 | 1160 | 290.9 |
| D | 12 | 218 | 322372 | 1104.05 | 1208 | 1160 | 290.9 |
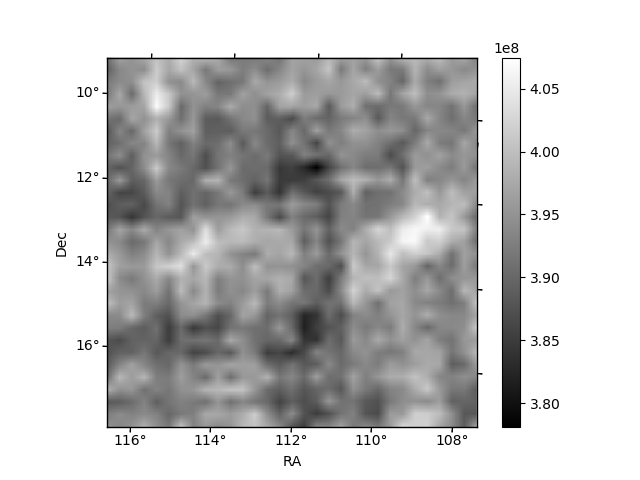
Histogram calculated using DETX and DETY for each event in the final _common_clean file
| Quadrant A |  |
 |
Quadrant B |
|---|---|---|---|
| Quadrant D |  |
 |
Quadrant C |
| Plot type | Count rate plots | Images |
|---|---|---|
| Comparison with Poisson distribution Blue bars denote a histogram of data divided into 1 sec bins. Red curve is a Poisson curve with rate = median count rate of data. |
 |
 |
| Quadrant-wise count rates Data is divided into 100 sec bins |
 |
|
| Module-wise count rates for Quadrant A Data is divided into 100 sec bins |
 |
 |
| Module-wise count rates for Quadrant B Data is divided into 100 sec bins |
 |
 |
| Module-wise count rates for Quadrant C Data is divided into 100 sec bins |
 |
 |
| Module-wise count rates for Quadrant D Data is divided into 100 sec bins |
 |
 |
| Parameter | Plot |
|---|---|
| CZT HV Monitor | 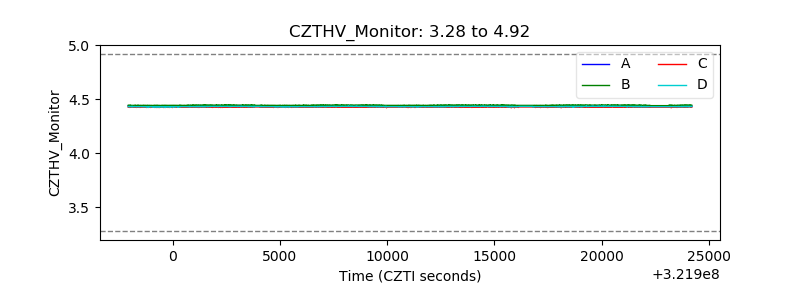 |
| D_VDD |  |
| Temperature 1 |  |
| Veto HV Monitor | 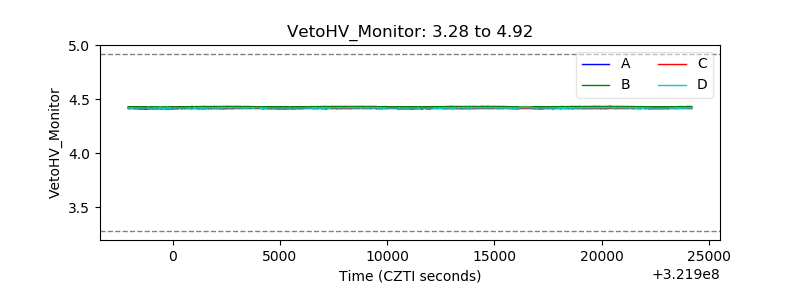 |
| Veto LLD |  |
| Alpha Counter |  |
| _CPM_Rate |  |
| CZT Counter | 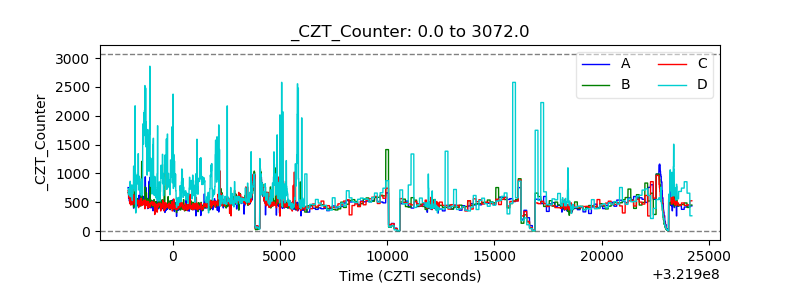 |
| +2.5 Volts monitor |  |
| +5 Volts monitor |  |
| _ROLL_ROT |  |
| _Roll_DEC | 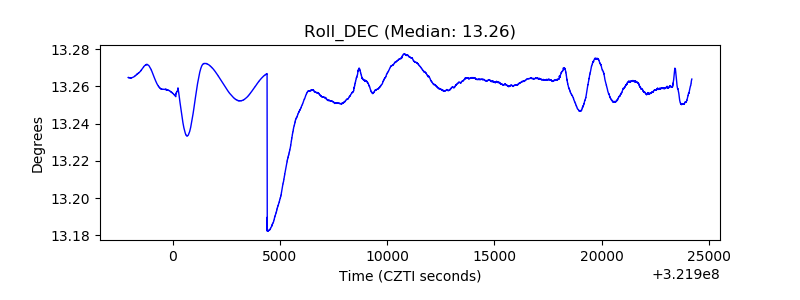 |
| _Roll_RA |  |
| Veto Counter |  |