| Param | Original file | Final file |
|---|---|---|
| Filename | modeM0/AS1C05_012T04_9000003564cztM0_level2_bc.evt | modeM0/AS1C05_012T04_9000003564cztM0_level2_quad_clean.evt |
| Size (bytes) | 3,827,695,680 | 1,632,467,520 |
| Size | 3.6 GB | 1.5 GB |
| Events in quadrant A | 17,882,821 | 11,309,426 |
| Events in quadrant B | 18,772,364 | 11,369,791 |
| Events in quadrant C | 17,617,712 | 10,858,321 |
| Events in quadrant D | 55,948,245 | 10,166,061 |
| Mode SS | |||
|---|---|---|---|
| Quadrant | BADHDUFLAG | Total packets | Discarded packets |
| A | 0 | 1708 | 0 |
| B | 0 | 1708 | 0 |
| C | 0 | 1708 | 0 |
| D | 0 | 1708 | 0 |
| Mode M0 | |||
|---|---|---|---|
| Quadrant | BADHDUFLAG | Total packets | Discarded packets |
| A | 0 | 172506 | 0 |
| B | 0 | 175854 | 0 |
| C | 0 | 173918 | 0 |
| D | 0 | 291807 | 0 |
| Mode M9 | |||
|---|---|---|---|
| Quadrant | BADHDUFLAG | Total packets | Discarded packets |
| A | 0 | 146 | 0 |
| B | 0 | 146 | 0 |
| C | 0 | 146 | 0 |
| D | 0 | 146 | 0 |
| Quadrant | Total seconds | Saturated seconds | Saturation percentage |
|---|---|---|---|
| A | 83822 | 766 | 0.913841% |
| B | 83822 | 1178 | 1.405359% |
| C | 83822 | 1332 | 1.589082% |
| D | 83822 | 8476 | 10.111904% |
Noise dominated data is calculated using 1-second bins in cleaned event files. If a bin has >2000 counts, and if more than 50% of those come from <1% of pixels, then it is considered to be noise-dominated and hence unusable.
| Quadrant | # 1 sec bins | Bins with >0 counts | Bins with >2000 counts | High rate bins dominated by noise | Noise dominated (total time) | Noise dominated (detector-on time) | Marked lightcurve |
|---|---|---|---|---|---|---|---|
| A | 98403 | 83820 | 4 | 4 | 0.00% | 0.00% |  |
| B | 98403 | 83816 | 54 | 54 | 0.05% | 0.06% |  |
| C | 98403 | 83815 | 30 | 30 | 0.03% | 0.04% |  |
| D | 98403 | 83816 | 3922 | 3922 | 3.99% | 4.68% |  |
Top three noisy pixels from each quadrant. If the there are fewer than three noisy pixels in the level2.evt file, extra rows are filled as -1
| Pixel properties | Quadrant properties | ||||||
|---|---|---|---|---|---|---|---|
| Quadrant | DetID | PixID | Counts | Sigma | Mean | Median | Sigma |
| A | 13 | 254 | 135339 | 132.64 | 4552 | 4487 | 986.5 |
| A | 0 | 23 | 117744 | 114.81 | 4552 | 4487 | 986.5 |
| A | 2 | 250 | 101518 | 98.36 | 4552 | 4487 | 986.5 |
| B | 0 | 245 | 247176 | 284.03 | 4545 | 4447 | 854.6 |
| B | 5 | 172 | 206219 | 236.1 | 4545 | 4447 | 854.6 |
| B | 0 | 228 | 179421 | 204.74 | 4545 | 4447 | 854.6 |
| C | 0 | 239 | 497239 | 488.54 | 4328 | 4323 | 1009.0 |
| C | 7 | 247 | 294534 | 287.63 | 4328 | 4323 | 1009.0 |
| C | 3 | 233 | 124205 | 118.82 | 4328 | 4323 | 1009.0 |
| D | 8 | 195 | 20679358 | 20069.08 | 4302 | 4151 | 1030.2 |
| D | 1 | 52 | 14730844 | 14294.95 | 4302 | 4151 | 1030.2 |
| D | 12 | 233 | 1290281 | 1248.42 | 4302 | 4151 | 1030.2 |
Histogram calculated using DETX and DETY for each event in the final _common_clean file
| Quadrant A |  |
 |
Quadrant B |
|---|---|---|---|
| Quadrant D |  |
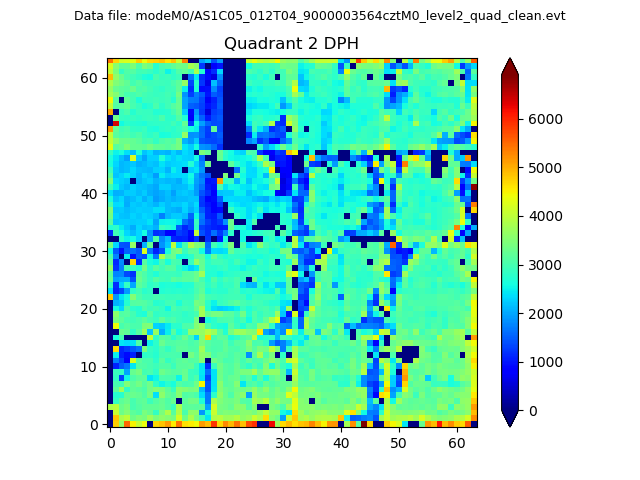 |
Quadrant C |
| Plot type | Count rate plots | Images |
|---|---|---|
| Comparison with Poisson distribution Blue bars denote a histogram of data divided into 1 sec bins. Red curve is a Poisson curve with rate = median count rate of data. |
 |
 |
| Quadrant-wise count rates Data is divided into 100 sec bins |
 |
|
| Module-wise count rates for Quadrant A Data is divided into 100 sec bins |
 |
 |
| Module-wise count rates for Quadrant B Data is divided into 100 sec bins |
 |
 |
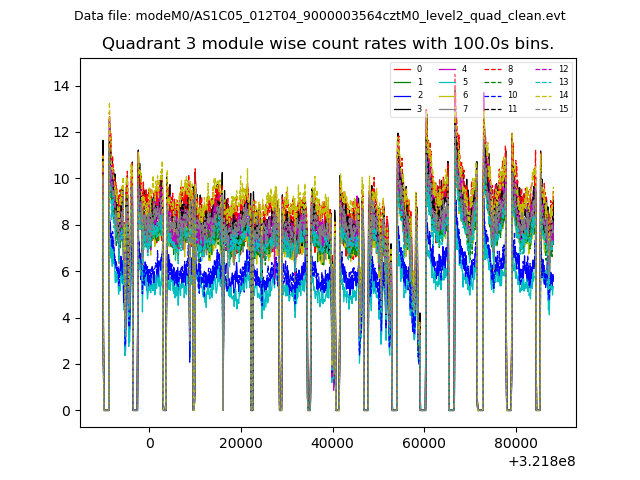
| Module-wise count rates for Quadrant C Data is divided into 100 sec bins |
 |
 |
| Module-wise count rates for Quadrant D Data is divided into 100 sec bins |
 |
 |
| Parameter | Plot |
|---|---|
| CZT HV Monitor |  |
| D_VDD |  |
| Temperature 1 | 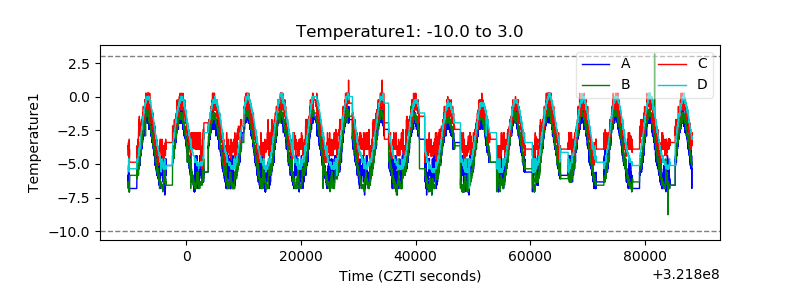 |
| Veto HV Monitor | 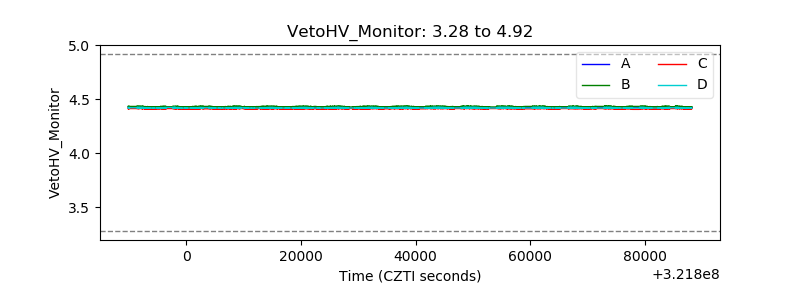 |
| Veto LLD |  |
| Alpha Counter |  |
| _CPM_Rate |  |
| CZT Counter | 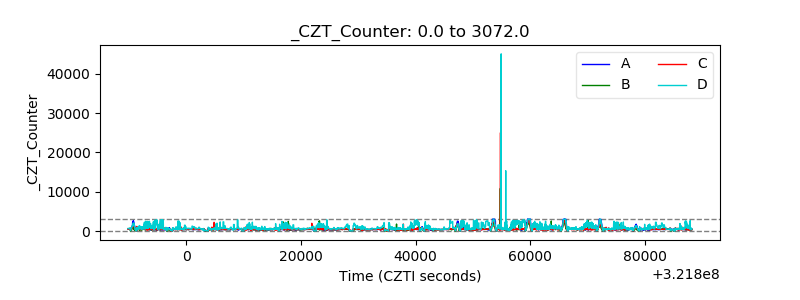 |
| +2.5 Volts monitor |  |
| +5 Volts monitor |  |
| _ROLL_ROT |  |
| _Roll_DEC |  |
| _Roll_RA |  |
| Veto Counter | 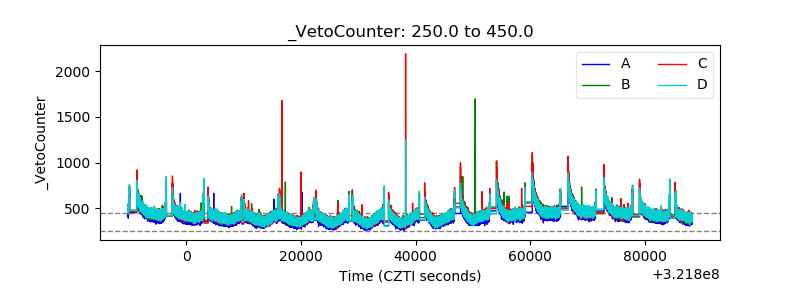 |