| Param | Original file | Final file |
|---|---|---|
| Filename | modeM0/AS1T03_182T01_9000003560cztM0_level2_bc.evt | modeM0/AS1T03_182T01_9000003560cztM0_level2_quad_clean.evt |
| Size (bytes) | 3,235,795,200 | 1,034,461,440 |
| Size | 3.0 GB | 986.5 MB |
| Events in quadrant A | 17,477,049 | 6,582,031 |
| Events in quadrant B | 19,836,785 | 6,639,753 |
| Events in quadrant C | 17,582,945 | 6,389,556 |
| Events in quadrant D | 37,623,628 | 6,207,023 |
| Mode SS | |||
|---|---|---|---|
| Quadrant | BADHDUFLAG | Total packets | Discarded packets |
| A | 0 | 1638 | 0 |
| B | 0 | 1638 | 0 |
| C | 0 | 1638 | 0 |
| D | 0 | 1638 | 0 |
| Mode M9 | |||
|---|---|---|---|
| Quadrant | BADHDUFLAG | Total packets | Discarded packets |
| A | 0 | 130 | 0 |
| B | 0 | 130 | 0 |
| C | 0 | 130 | 0 |
| D | 0 | 130 | 0 |
| Mode M0 | |||
|---|---|---|---|
| Quadrant | BADHDUFLAG | Total packets | Discarded packets |
| A | 0 | 167560 | 0 |
| B | 0 | 177643 | 0 |
| C | 0 | 168894 | 0 |
| D | 0 | 235673 | 0 |
| Quadrant | Total seconds | Saturated seconds | Saturation percentage |
|---|---|---|---|
| A | 80453 | 824 | 1.024200% |
| B | 80453 | 1381 | 1.716530% |
| C | 80453 | 1229 | 1.527600% |
| D | 80453 | 3643 | 4.528110% |
Noise dominated data is calculated using 1-second bins in cleaned event files. If a bin has >2000 counts, and if more than 50% of those come from <1% of pixels, then it is considered to be noise-dominated and hence unusable.
| Quadrant | # 1 sec bins | Bins with >0 counts | Bins with >2000 counts | High rate bins dominated by noise | Noise dominated (total time) | Noise dominated (detector-on time) | Marked lightcurve |
|---|---|---|---|---|---|---|---|
| A | 93403 | 80452 | 2 | 2 | 0.00% | 0.00% |  |
| B | 93403 | 80449 | 73 | 73 | 0.08% | 0.09% |  |
| C | 93403 | 80452 | 1 | 1 | 0.00% | 0.00% | 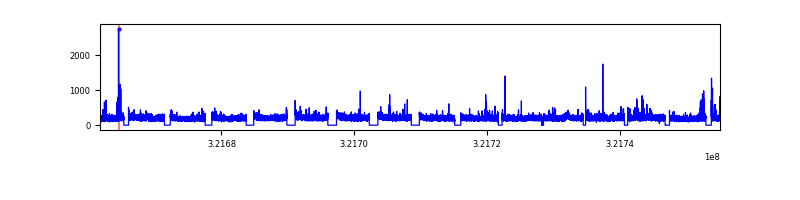 |
| D | 93403 | 80448 | 620 | 620 | 0.66% | 0.77% |  |
Top three noisy pixels from each quadrant. If the there are fewer than three noisy pixels in the level2.evt file, extra rows are filled as -1
| Pixel properties | Quadrant properties | ||||||
|---|---|---|---|---|---|---|---|
| Quadrant | DetID | PixID | Counts | Sigma | Mean | Median | Sigma |
| A | 2 | 250 | 197498 | 201.74 | 4451 | 4370 | 957.3 |
| A | 13 | 254 | 131781 | 133.09 | 4451 | 4370 | 957.3 |
| A | 6 | 16 | 63874 | 62.16 | 4451 | 4370 | 957.3 |
| B | 0 | 197 | 858135 | 1016.07 | 4460 | 4349 | 840.3 |
| B | 0 | 245 | 680430 | 804.59 | 4460 | 4349 | 840.3 |
| B | 0 | 189 | 394723 | 464.58 | 4460 | 4349 | 840.3 |
| C | 7 | 247 | 720373 | 708.31 | 4289 | 4279 | 1011.0 |
| C | 0 | 239 | 144024 | 138.23 | 4289 | 4279 | 1011.0 |
| C | 10 | 91 | 129451 | 123.81 | 4289 | 4279 | 1011.0 |
| D | 8 | 195 | 8313732 | 8208.35 | 4337 | 4190 | 1012.3 |
| D | 1 | 52 | 4727404 | 4665.69 | 4337 | 4190 | 1012.3 |
| D | 12 | 218 | 3977760 | 3925.18 | 4337 | 4190 | 1012.3 |
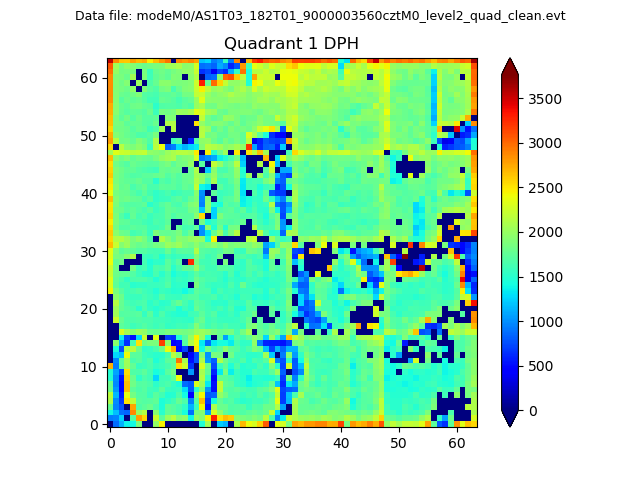
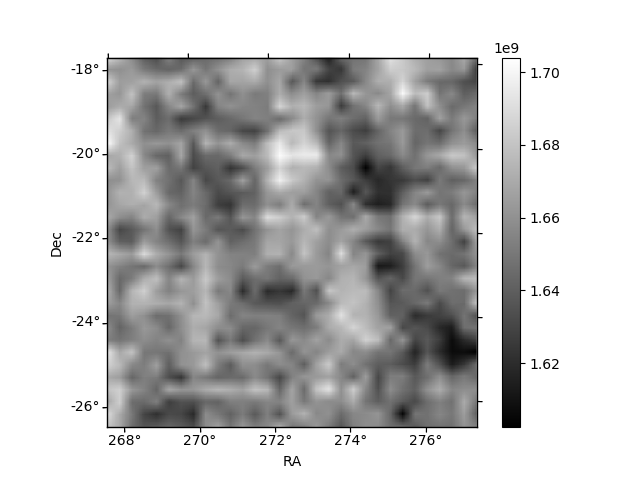
Histogram calculated using DETX and DETY for each event in the final _common_clean file
| Quadrant A |  |
 |
Quadrant B |
|---|---|---|---|
| Quadrant D |  |
 |
Quadrant C |
| Plot type | Count rate plots | Images |
|---|---|---|
| Comparison with Poisson distribution Blue bars denote a histogram of data divided into 1 sec bins. Red curve is a Poisson curve with rate = median count rate of data. |
 |
 |
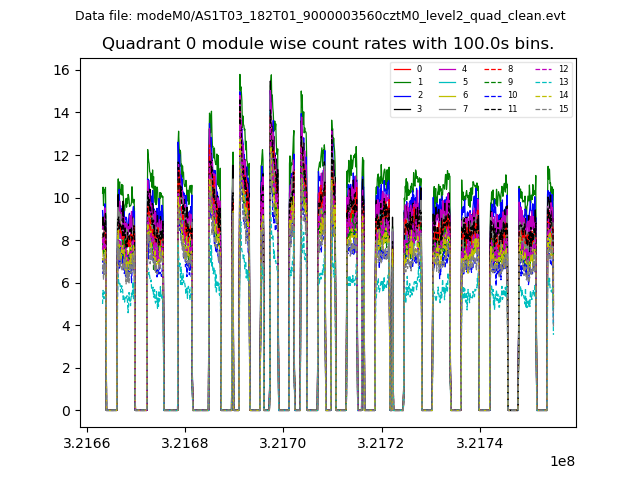
| Quadrant-wise count rates Data is divided into 100 sec bins |
 |
|
| Module-wise count rates for Quadrant A Data is divided into 100 sec bins |
 |
 |
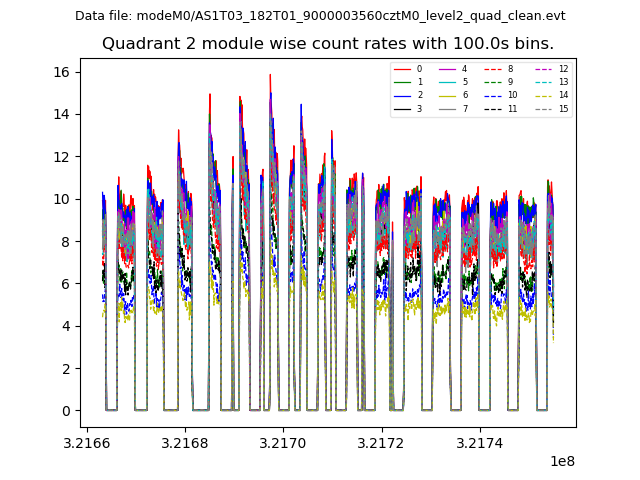
| Module-wise count rates for Quadrant B Data is divided into 100 sec bins |
 |
 |
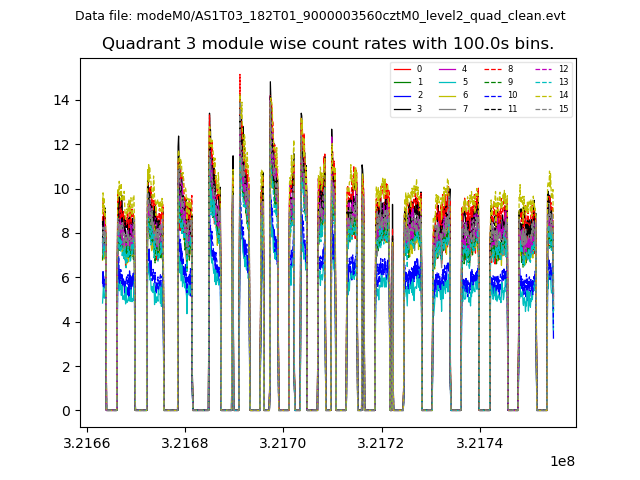
| Module-wise count rates for Quadrant C Data is divided into 100 sec bins |
 |
 |
| Module-wise count rates for Quadrant D Data is divided into 100 sec bins |
 |
 |
| Parameter | Plot |
|---|---|
| CZT HV Monitor |  |
| D_VDD |  |
| Temperature 1 |  |
| Veto HV Monitor | 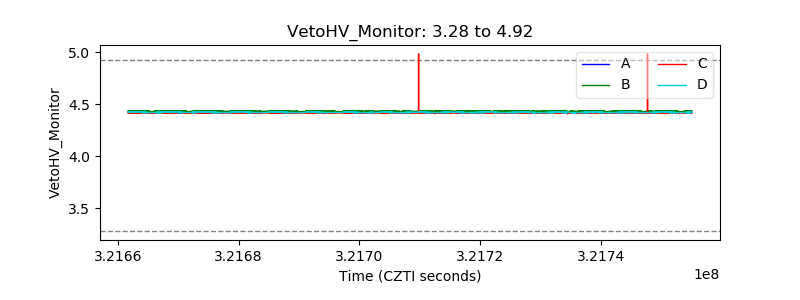 |
| Veto LLD |  |
| Alpha Counter |  |
| _CPM_Rate |  |
| CZT Counter |  |
| +2.5 Volts monitor |  |
| +5 Volts monitor |  |
| _ROLL_ROT | 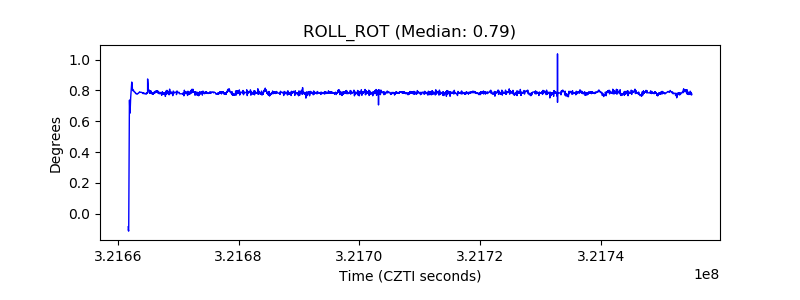 |
| _Roll_DEC |  |
| _Roll_RA |  |
| Veto Counter |  |