| Param | Original file | Final file |
|---|---|---|
| Filename | modeM0/AS1A07_165T01_9000003558cztM0_level2_bc.evt | modeM0/AS1A07_165T01_9000003558cztM0_level2_quad_clean.evt |
| Size (bytes) | 19,112,713,920 | 9,416,825,280 |
| Size | 17.8 GB | 8.8 GB |
| Events in quadrant A | 104,966,889 | 65,341,849 |
| Events in quadrant B | 114,850,497 | 66,229,869 |
| Events in quadrant C | 115,692,756 | 63,153,239 |
| Events in quadrant D | 213,035,696 | 60,027,973 |
| Mode M9 | |||
|---|---|---|---|
| Quadrant | BADHDUFLAG | Total packets | Discarded packets |
| A | 0 | 766 | 0 |
| B | 0 | 766 | 0 |
| C | 0 | 766 | 0 |
| D | 0 | 766 | 0 |
| Mode M0 | |||
|---|---|---|---|
| Quadrant | BADHDUFLAG | Total packets | Discarded packets |
| A | 0 | 993321 | 0 |
| B | 0 | 1030436 | 0 |
| C | 0 | 1036386 | 0 |
| D | 0 | 1391527 | 0 |
| Mode SS | |||
|---|---|---|---|
| Quadrant | BADHDUFLAG | Total packets | Discarded packets |
| A | 0 | 4852 | 0 |
| B | 0 | 4852 | 0 |
| C | 0 | 4852 | 0 |
| D | 0 | 4852 | 0 |
| Quadrant | Total seconds | Saturated seconds | Saturation percentage |
|---|---|---|---|
| A | 476635 | 4415 | 0.926285% |
| B | 476635 | 6195 | 1.299737% |
| C | 476635 | 9037 | 1.896000% |
| D | 476635 | 32191 | 6.753805% |
Noise dominated data is calculated using 1-second bins in cleaned event files. If a bin has >2000 counts, and if more than 50% of those come from <1% of pixels, then it is considered to be noise-dominated and hence unusable.
| Quadrant | # 1 sec bins | Bins with >0 counts | Bins with >2000 counts | High rate bins dominated by noise | Noise dominated (total time) | Noise dominated (detector-on time) | Marked lightcurve |
|---|---|---|---|---|---|---|---|
| A | 553034 | 476640 | 195 | 195 | 0.04% | 0.04% |  |
| B | 553034 | 476635 | 101 | 101 | 0.02% | 0.02% |  |
| C | 553034 | 476633 | 856 | 856 | 0.15% | 0.18% |  |
| D | 553034 | 476579 | 4203 | 4203 | 0.76% | 0.88% | 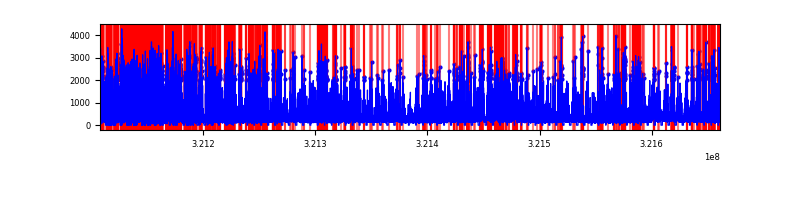 |
Top three noisy pixels from each quadrant. If the there are fewer than three noisy pixels in the level2.evt file, extra rows are filled as -1
| Pixel properties | Quadrant properties | ||||||
|---|---|---|---|---|---|---|---|
| Quadrant | DetID | PixID | Counts | Sigma | Mean | Median | Sigma |
| A | 6 | 16 | 2677861 | 468.45 | 26344 | 25979 | 5661.0 |
| A | 13 | 254 | 737674 | 125.72 | 26344 | 25979 | 5661.0 |
| A | 3 | 1 | 399674 | 66.01 | 26344 | 25979 | 5661.0 |
| B | 0 | 197 | 6186807 | 1245.22 | 26516 | 25999 | 4947.6 |
| B | 0 | 189 | 1776595 | 353.83 | 26516 | 25999 | 4947.6 |
| B | 7 | 202 | 839355 | 164.4 | 26516 | 25999 | 4947.6 |
| C | 7 | 247 | 8970645 | 1497.94 | 25237 | 25246 | 5971.8 |
| C | 0 | 239 | 4216762 | 701.89 | 25237 | 25246 | 5971.8 |
| C | 10 | 9 | 3488182 | 579.88 | 25237 | 25246 | 5971.8 |
| D | 8 | 195 | 42862758 | 7223.43 | 25243 | 24442 | 5930.5 |
| D | 12 | 218 | 39868865 | 6718.6 | 25243 | 24442 | 5930.5 |
| D | 1 | 52 | 19454502 | 3276.31 | 25243 | 24442 | 5930.5 |
Histogram calculated using DETX and DETY for each event in the final _common_clean file
| Quadrant A |  |
 |
Quadrant B |
|---|---|---|---|
| Quadrant D |  |
 |
Quadrant C |
| Plot type | Count rate plots | Images |
|---|---|---|
| Comparison with Poisson distribution Blue bars denote a histogram of data divided into 1 sec bins. Red curve is a Poisson curve with rate = median count rate of data. |
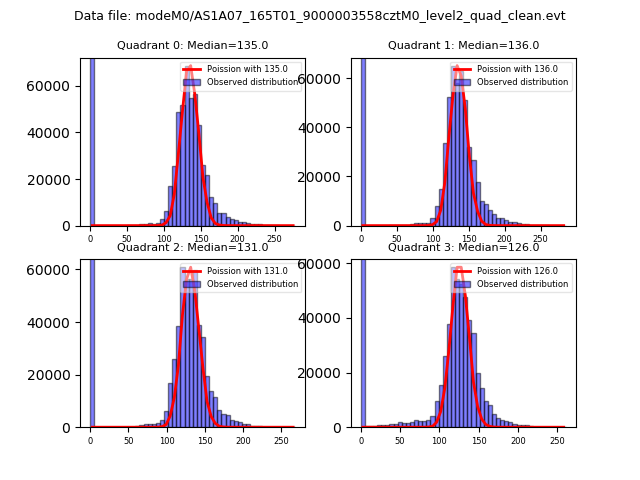 |
 |
| Quadrant-wise count rates Data is divided into 100 sec bins |
 |
|
| Module-wise count rates for Quadrant A Data is divided into 100 sec bins |
 |
 |
| Module-wise count rates for Quadrant B Data is divided into 100 sec bins |
 |
 |
| Module-wise count rates for Quadrant C Data is divided into 100 sec bins |
 |
 |
| Module-wise count rates for Quadrant D Data is divided into 100 sec bins |
 |
 |
| Parameter | Plot |
|---|---|
| CZT HV Monitor |  |
| D_VDD |  |
| Temperature 1 |  |
| Veto HV Monitor |  |
| Veto LLD | 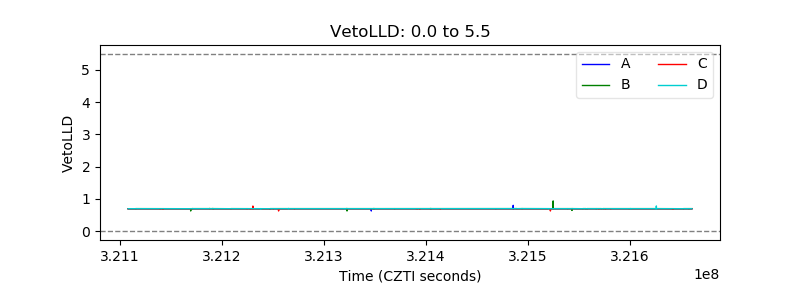 |
| Alpha Counter |  |
| _CPM_Rate |  |
| CZT Counter | 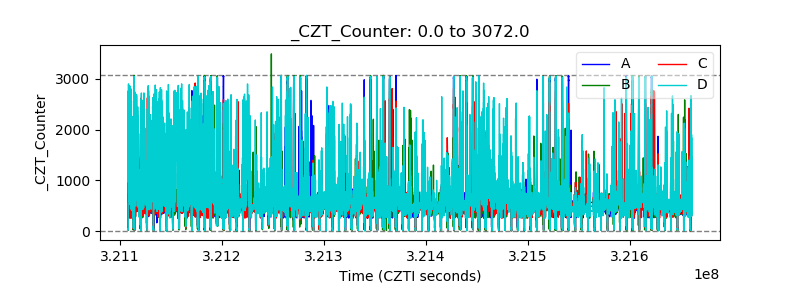 |
| +2.5 Volts monitor |  |
| +5 Volts monitor |  |
| _ROLL_ROT |  |
| _Roll_DEC |  |
| _Roll_RA |  |
| Veto Counter |  |