| Param | Original file | Final file |
|---|---|---|
| Filename | modeM0/AS1A07_065T01_9000003554cztM0_level2_bc.evt | modeM0/AS1A07_065T01_9000003554cztM0_level2_quad_clean.evt |
| Size (bytes) | 2,360,047,680 | 588,306,240 |
| Size | 2.2 GB | 561.1 MB |
| Events in quadrant A | 10,388,430 | 3,869,762 |
| Events in quadrant B | 14,530,344 | 3,885,807 |
| Events in quadrant C | 10,543,335 | 3,707,725 |
| Events in quadrant D | 32,565,211 | 2,886,630 |
| Mode M9 | |||
|---|---|---|---|
| Quadrant | BADHDUFLAG | Total packets | Discarded packets |
| A | 0 | 62 | 0 |
| B | 0 | 62 | 0 |
| C | 0 | 62 | 0 |
| D | 0 | 62 | 0 |
| Mode M0 | |||
|---|---|---|---|
| Quadrant | BADHDUFLAG | Total packets | Discarded packets |
| A | 0 | 104379 | 0 |
| B | 0 | 117382 | 0 |
| C | 0 | 106175 | 0 |
| D | 0 | 221172 | 0 |
| Mode SS | |||
|---|---|---|---|
| Quadrant | BADHDUFLAG | Total packets | Discarded packets |
| A | 0 | 1028 | 0 |
| B | 0 | 1028 | 0 |
| C | 0 | 1028 | 0 |
| D | 0 | 1028 | 0 |
| Quadrant | Total seconds | Saturated seconds | Saturation percentage |
|---|---|---|---|
| A | 50482 | 408 | 0.808209% |
| B | 50482 | 1713 | 3.393289% |
| C | 50482 | 932 | 1.846203% |
| D | 50482 | 15800 | 31.298285% |
Noise dominated data is calculated using 1-second bins in cleaned event files. If a bin has >2000 counts, and if more than 50% of those come from <1% of pixels, then it is considered to be noise-dominated and hence unusable.
| Quadrant | # 1 sec bins | Bins with >0 counts | Bins with >2000 counts | High rate bins dominated by noise | Noise dominated (total time) | Noise dominated (detector-on time) | Marked lightcurve |
|---|---|---|---|---|---|---|---|
| A | 56697 | 50483 | 0 | 0 | 0.00% | 0.00% |  |
| B | 56697 | 50482 | 257 | 257 | 0.45% | 0.51% | 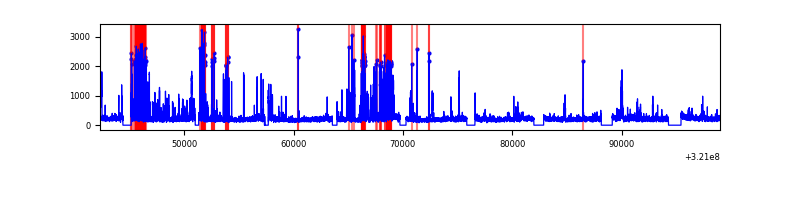 |
| C | 56697 | 50485 | 7 | 7 | 0.01% | 0.01% |  |
| D | 56697 | 49976 | 1068 | 1068 | 1.88% | 2.14% |  |
Top three noisy pixels from each quadrant. If the there are fewer than three noisy pixels in the level2.evt file, extra rows are filled as -1
| Pixel properties | Quadrant properties | ||||||
|---|---|---|---|---|---|---|---|
| Quadrant | DetID | PixID | Counts | Sigma | Mean | Median | Sigma |
| A | 13 | 254 | 74554 | 124.51 | 2677 | 2625 | 577.7 |
| A | 2 | 79 | 41310 | 66.96 | 2677 | 2625 | 577.7 |
| A | 0 | 226 | 17231 | 25.28 | 2677 | 2625 | 577.7 |
| B | 4 | 200 | 3563757 | 7017.35 | 2683 | 2621 | 507.5 |
| B | 0 | 197 | 459394 | 900.09 | 2683 | 2621 | 507.5 |
| B | 0 | 190 | 70656 | 134.07 | 2683 | 2621 | 507.5 |
| C | 0 | 10 | 674029 | 1111.69 | 2556 | 2544 | 604.0 |
| C | 7 | 247 | 20443 | 29.63 | 2556 | 2544 | 604.0 |
| C | 5 | 37 | 14738 | 20.19 | 2556 | 2544 | 604.0 |
| D | 12 | 218 | 18633686 | 37205.64 | 2128 | 2053 | 500.8 |
| D | 7 | 238 | 1691301 | 3373.27 | 2128 | 2053 | 500.8 |
| D | 1 | 52 | 1322966 | 2637.74 | 2128 | 2053 | 500.8 |
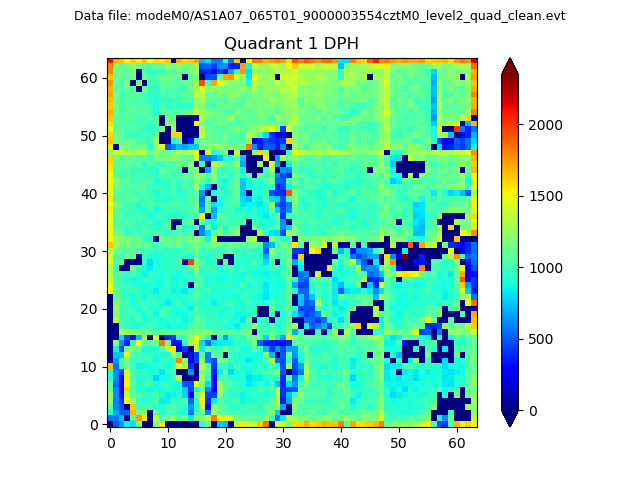
Histogram calculated using DETX and DETY for each event in the final _common_clean file
| Quadrant A |  |
 |
Quadrant B |
|---|---|---|---|
| Quadrant D |  |
 |
Quadrant C |
| Plot type | Count rate plots | Images |
|---|---|---|
| Comparison with Poisson distribution Blue bars denote a histogram of data divided into 1 sec bins. Red curve is a Poisson curve with rate = median count rate of data. |
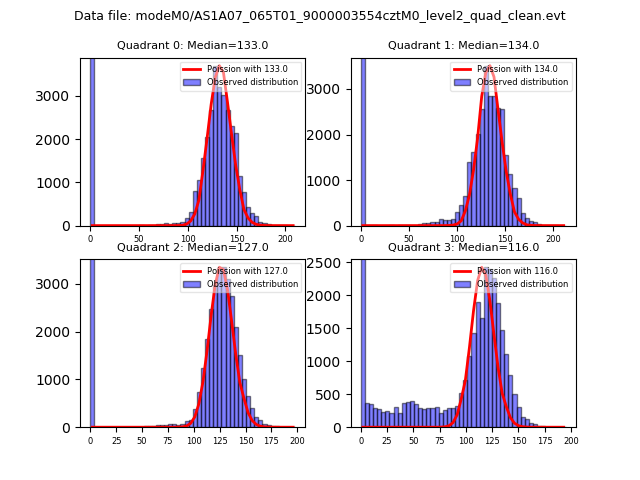 |
 |
| Quadrant-wise count rates Data is divided into 100 sec bins |
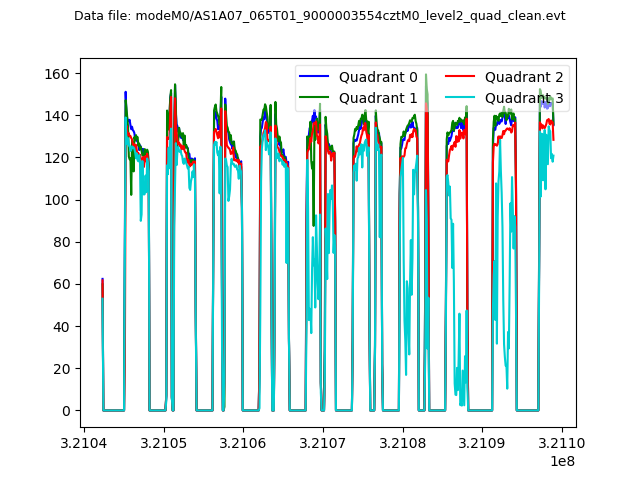 |
|
| Module-wise count rates for Quadrant A Data is divided into 100 sec bins |
 |
 |
| Module-wise count rates for Quadrant B Data is divided into 100 sec bins |
 |
 |
| Module-wise count rates for Quadrant C Data is divided into 100 sec bins |
 |
 |
| Module-wise count rates for Quadrant D Data is divided into 100 sec bins |
 |
 |
| Parameter | Plot |
|---|---|
| CZT HV Monitor |  |
| D_VDD | 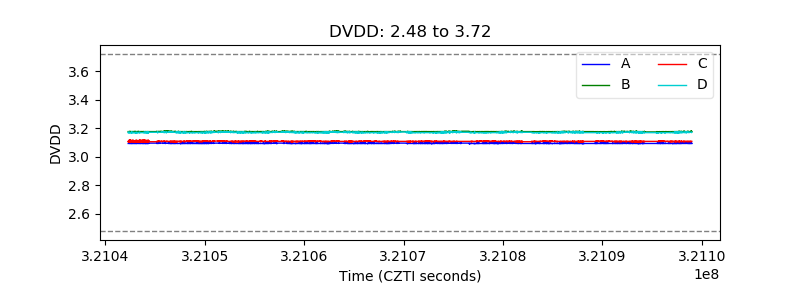 |
| Temperature 1 |  |
| Veto HV Monitor |  |
| Veto LLD |  |
| Alpha Counter |  |
| _CPM_Rate |  |
| CZT Counter |  |
| +2.5 Volts monitor |  |
| +5 Volts monitor |  |
| _ROLL_ROT |  |
| _Roll_DEC |  |
| _Roll_RA |  |
| Veto Counter | 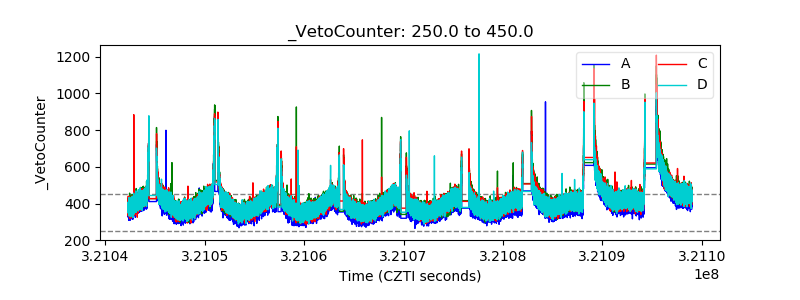 |