| Param | Original file | Final file |
|---|---|---|
| Filename | modeM0/AS1A07_001T05_9000003550cztM0_level2_bc.evt | modeM0/AS1A07_001T05_9000003550cztM0_level2_quad_clean.evt |
| Size (bytes) | 378,702,720 | 183,165,120 |
| Size | 361.2 MB | 174.7 MB |
| Events in quadrant A | 2,060,966 | 1,322,600 |
| Events in quadrant B | 2,221,639 | 1,325,180 |
| Events in quadrant C | 2,345,752 | 1,223,164 |
| Events in quadrant D | 4,256,040 | 1,088,622 |
| Mode M9 | |||
|---|---|---|---|
| Quadrant | BADHDUFLAG | Total packets | Discarded packets |
| A | 0 | 27 | 0 |
| B | 0 | 27 | 0 |
| C | 0 | 27 | 0 |
| D | 0 | 27 | 0 |
| Mode M0 | |||
|---|---|---|---|
| Quadrant | BADHDUFLAG | Total packets | Discarded packets |
| A | 0 | 18384 | 0 |
| B | 0 | 18891 | 0 |
| C | 0 | 19678 | 0 |
| D | 0 | 31212 | 0 |
| Mode SS | |||
|---|---|---|---|
| Quadrant | BADHDUFLAG | Total packets | Discarded packets |
| A | 0 | 172 | 0 |
| B | 0 | 172 | 0 |
| C | 0 | 172 | 0 |
| D | 0 | 172 | 0 |
| Quadrant | Total seconds | Saturated seconds | Saturation percentage |
|---|---|---|---|
| A | 8468 | 115 | 1.358054% |
| B | 8468 | 139 | 1.641474% |
| C | 8468 | 294 | 3.471894% |
| D | 8468 | 1768 | 20.878602% |
Noise dominated data is calculated using 1-second bins in cleaned event files. If a bin has >2000 counts, and if more than 50% of those come from <1% of pixels, then it is considered to be noise-dominated and hence unusable.
| Quadrant | # 1 sec bins | Bins with >0 counts | Bins with >2000 counts | High rate bins dominated by noise | Noise dominated (total time) | Noise dominated (detector-on time) | Marked lightcurve |
|---|---|---|---|---|---|---|---|
| A | 11083 | 8468 | 0 | 0 | 0.00% | 0.00% |  |
| B | 11083 | 8468 | 8 | 8 | 0.07% | 0.09% |  |
| C | 11083 | 8468 | 6 | 6 | 0.05% | 0.07% |  |
| D | 11083 | 8467 | 56 | 56 | 0.51% | 0.66% |  |
Top three noisy pixels from each quadrant. If the there are fewer than three noisy pixels in the level2.evt file, extra rows are filled as -1
| Pixel properties | Quadrant properties | ||||||
|---|---|---|---|---|---|---|---|
| Quadrant | DetID | PixID | Counts | Sigma | Mean | Median | Sigma |
| A | 13 | 254 | 14253 | 117.63 | 533 | 527 | 116.7 |
| A | 0 | 226 | 3546 | 25.87 | 533 | 527 | 116.7 |
| A | 12 | 194 | 3385 | 24.49 | 533 | 527 | 116.7 |
| B | 0 | 197 | 75810 | 749.26 | 529 | 520 | 100.5 |
| B | 0 | 245 | 49066 | 483.11 | 529 | 520 | 100.5 |
| B | 5 | 172 | 26797 | 261.5 | 529 | 520 | 100.5 |
| C | 0 | 10 | 239859 | 2051.85 | 490 | 491 | 116.7 |
| C | 0 | 239 | 189535 | 1620.48 | 490 | 491 | 116.7 |
| C | 7 | 221 | 28046 | 236.2 | 490 | 491 | 116.7 |
| D | 12 | 218 | 2030868 | 18772.44 | 458 | 443 | 108.2 |
| D | 2 | 82 | 165510 | 1526.14 | 458 | 443 | 108.2 |
| D | 12 | 250 | 73695 | 677.26 | 458 | 443 | 108.2 |
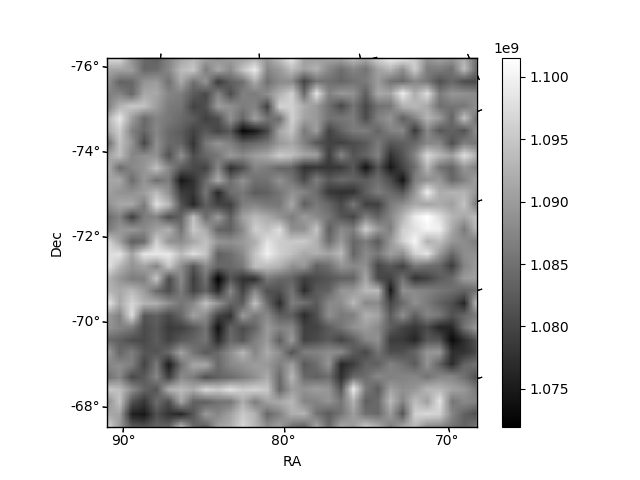
Histogram calculated using DETX and DETY for each event in the final _common_clean file
| Quadrant A |  |
 |
Quadrant B |
|---|---|---|---|
| Quadrant D |  |
 |
Quadrant C |
| Plot type | Count rate plots | Images |
|---|---|---|
| Comparison with Poisson distribution Blue bars denote a histogram of data divided into 1 sec bins. Red curve is a Poisson curve with rate = median count rate of data. |
 |
 |
| Quadrant-wise count rates Data is divided into 100 sec bins |
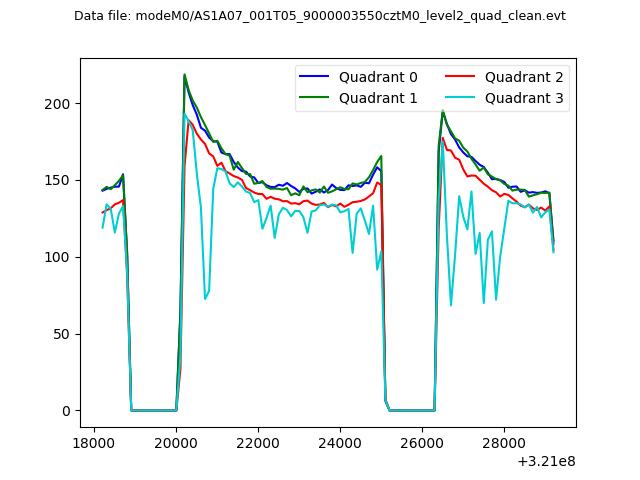 |
|
| Module-wise count rates for Quadrant A Data is divided into 100 sec bins |
 |
 |
| Module-wise count rates for Quadrant B Data is divided into 100 sec bins |
 |
 |
| Module-wise count rates for Quadrant C Data is divided into 100 sec bins |
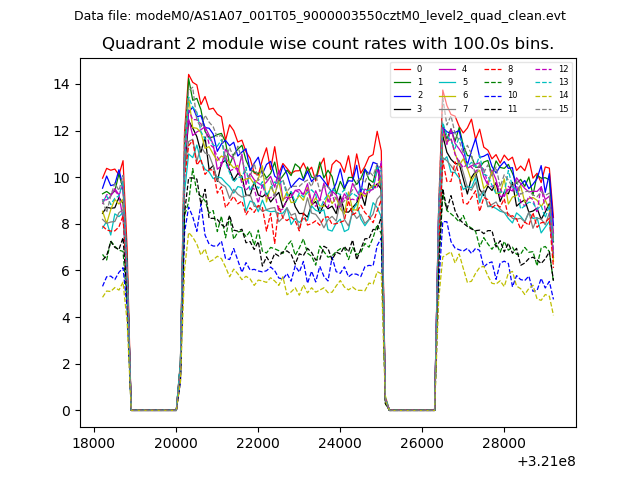 |
 |
| Module-wise count rates for Quadrant D Data is divided into 100 sec bins |
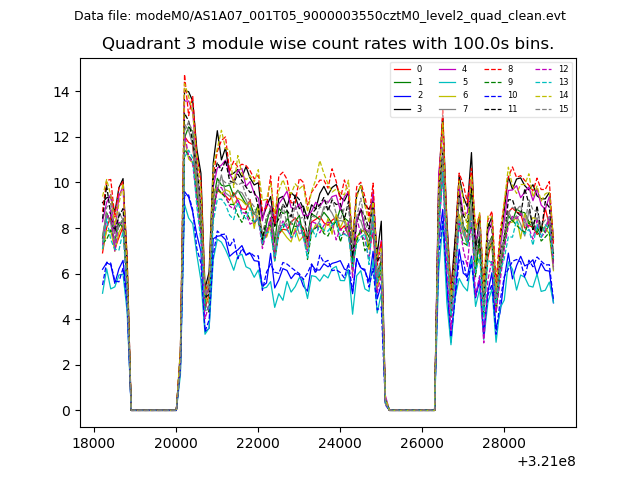 |
 |
| Parameter | Plot |
|---|---|
| CZT HV Monitor |  |
| D_VDD |  |
| Temperature 1 |  |
| Veto HV Monitor |  |
| Veto LLD |  |
| Alpha Counter | 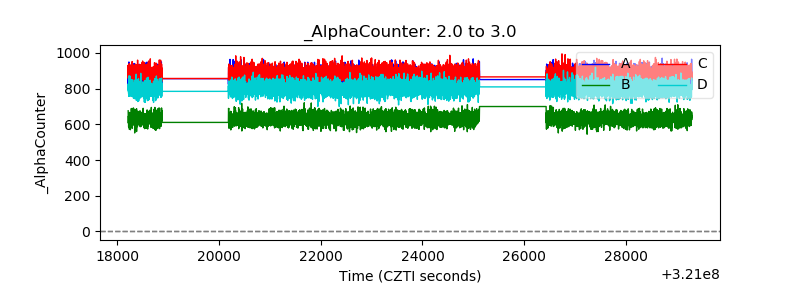 |
| _CPM_Rate |  |
| CZT Counter | 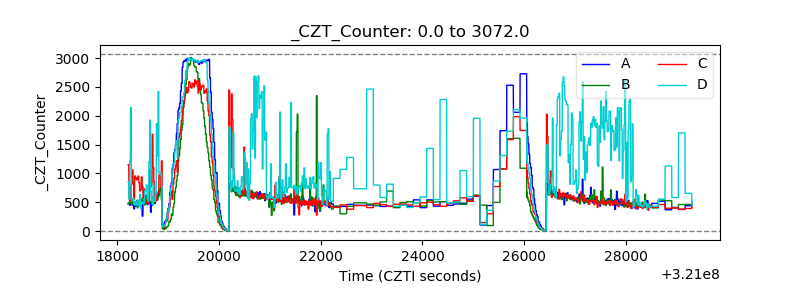 |
| +2.5 Volts monitor |  |
| +5 Volts monitor |  |
| _ROLL_ROT |  |
| _Roll_DEC | 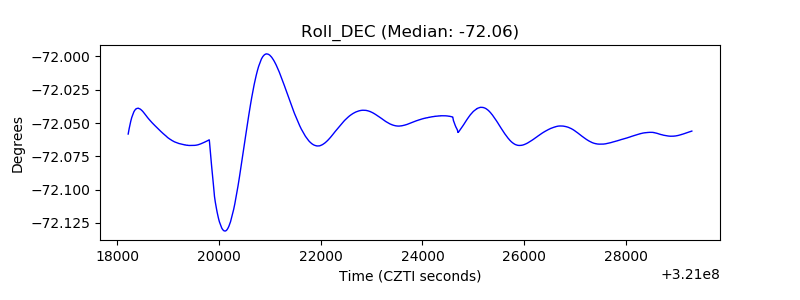 |
| _Roll_RA |  |
| Veto Counter | 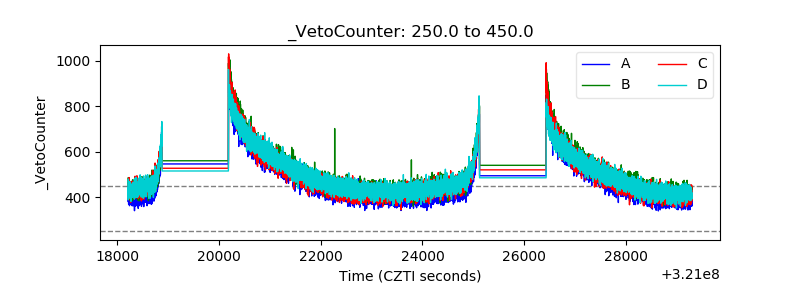 |