| Param | Original file | Final file |
|---|---|---|
| Filename | modeM0/AS1A07_001T04_9000003552cztM0_level2_bc.evt | modeM0/AS1A07_001T04_9000003552cztM0_level2_quad_clean.evt |
| Size (bytes) | 387,486,720 | 174,571,200 |
| Size | 369.5 MB | 166.5 MB |
| Events in quadrant A | 1,963,057 | 1,270,844 |
| Events in quadrant B | 2,438,956 | 1,267,964 |
| Events in quadrant C | 2,035,666 | 1,186,306 |
| Events in quadrant D | 4,676,662 | 938,122 |
| Mode M0 | |||
|---|---|---|---|
| Quadrant | BADHDUFLAG | Total packets | Discarded packets |
| A | 0 | 18676 | 0 |
| B | 0 | 20238 | 0 |
| C | 0 | 19257 | 0 |
| D | 0 | 35338 | 0 |
| Mode SS | |||
|---|---|---|---|
| Quadrant | BADHDUFLAG | Total packets | Discarded packets |
| A | 0 | 184 | 0 |
| B | 0 | 184 | 0 |
| C | 0 | 184 | 0 |
| D | 0 | 184 | 0 |
| Mode M9 | |||
|---|---|---|---|
| Quadrant | BADHDUFLAG | Total packets | Discarded packets |
| A | 0 | 23 | 0 |
| B | 0 | 23 | 0 |
| C | 0 | 23 | 0 |
| D | 0 | 23 | 0 |
| Quadrant | Total seconds | Saturated seconds | Saturation percentage |
|---|---|---|---|
| A | 8980 | 119 | 1.325167% |
| B | 8980 | 189 | 2.104677% |
| C | 8980 | 203 | 2.260579% |
| D | 8980 | 2668 | 29.710468% |
Noise dominated data is calculated using 1-second bins in cleaned event files. If a bin has >2000 counts, and if more than 50% of those come from <1% of pixels, then it is considered to be noise-dominated and hence unusable.
| Quadrant | # 1 sec bins | Bins with >0 counts | Bins with >2000 counts | High rate bins dominated by noise | Noise dominated (total time) | Noise dominated (detector-on time) | Marked lightcurve |
|---|---|---|---|---|---|---|---|
| A | 11365 | 8980 | 0 | 0 | 0.00% | 0.00% |  |
| B | 11365 | 8980 | 30 | 30 | 0.26% | 0.33% |  |
| C | 11365 | 8980 | 8 | 8 | 0.07% | 0.09% | 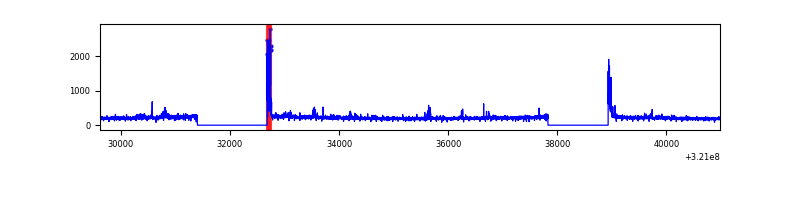 |
| D | 11365 | 8901 | 166 | 166 | 1.46% | 1.86% |  |
Top three noisy pixels from each quadrant. If the there are fewer than three noisy pixels in the level2.evt file, extra rows are filled as -1
| Pixel properties | Quadrant properties | ||||||
|---|---|---|---|---|---|---|---|
| Quadrant | DetID | PixID | Counts | Sigma | Mean | Median | Sigma |
| A | 13 | 254 | 15554 | 132.84 | 508 | 500 | 113.3 |
| A | 0 | 226 | 3388 | 25.48 | 508 | 500 | 113.3 |
| A | 12 | 194 | 3267 | 24.42 | 508 | 500 | 113.3 |
| B | 4 | 200 | 252377 | 2574.91 | 506 | 496 | 97.8 |
| B | 0 | 197 | 185209 | 1888.27 | 506 | 496 | 97.8 |
| B | 0 | 245 | 25262 | 253.18 | 506 | 496 | 97.8 |
| C | 0 | 10 | 161293 | 1425.01 | 473 | 472 | 112.9 |
| C | 7 | 221 | 28247 | 246.11 | 473 | 472 | 112.9 |
| C | 0 | 239 | 15306 | 131.44 | 473 | 472 | 112.9 |
| D | 12 | 218 | 2590689 | 26861.7 | 394 | 381 | 96.4 |
| D | 2 | 82 | 149090 | 1542.12 | 394 | 381 | 96.4 |
| D | 1 | 52 | 116388 | 1203.0 | 394 | 381 | 96.4 |
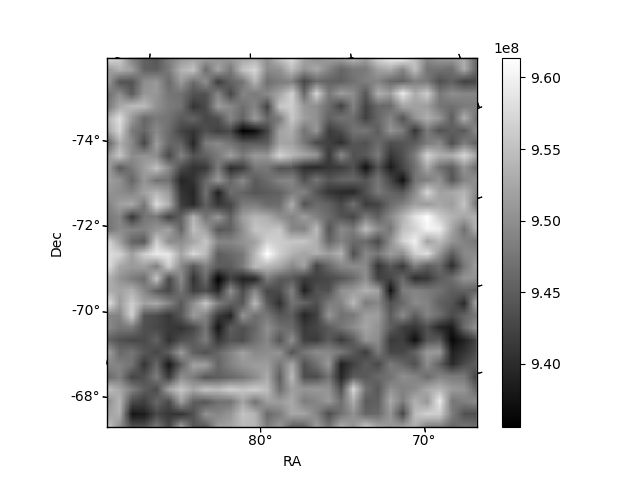
Histogram calculated using DETX and DETY for each event in the final _common_clean file
| Quadrant A |  |
 |
Quadrant B |
|---|---|---|---|
| Quadrant D |  |
 |
Quadrant C |
| Plot type | Count rate plots | Images |
|---|---|---|
| Comparison with Poisson distribution Blue bars denote a histogram of data divided into 1 sec bins. Red curve is a Poisson curve with rate = median count rate of data. |
 |
 |
| Quadrant-wise count rates Data is divided into 100 sec bins |
 |
|
| Module-wise count rates for Quadrant A Data is divided into 100 sec bins |
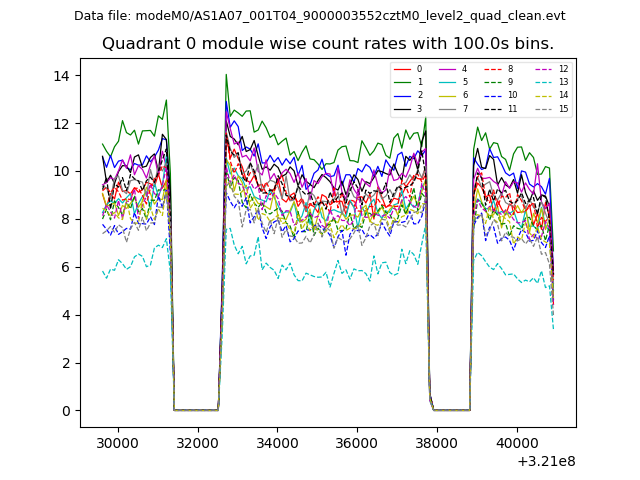 |
 |
| Module-wise count rates for Quadrant B Data is divided into 100 sec bins |
 |
 |
| Module-wise count rates for Quadrant C Data is divided into 100 sec bins |
 |
 |
| Module-wise count rates for Quadrant D Data is divided into 100 sec bins |
 |
 |
| Parameter | Plot |
|---|---|
| CZT HV Monitor |  |
| D_VDD |  |
| Temperature 1 |  |
| Veto HV Monitor | 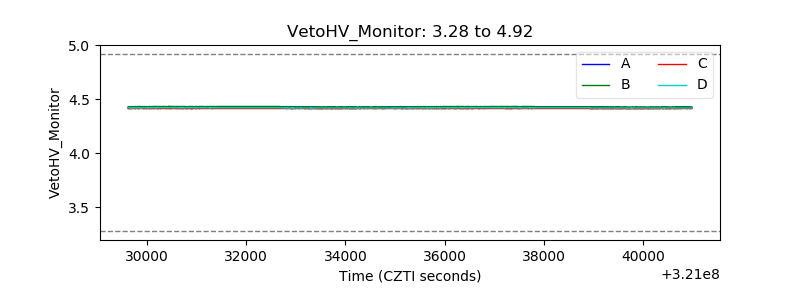 |
| Veto LLD |  |
| Alpha Counter |  |
| _CPM_Rate | 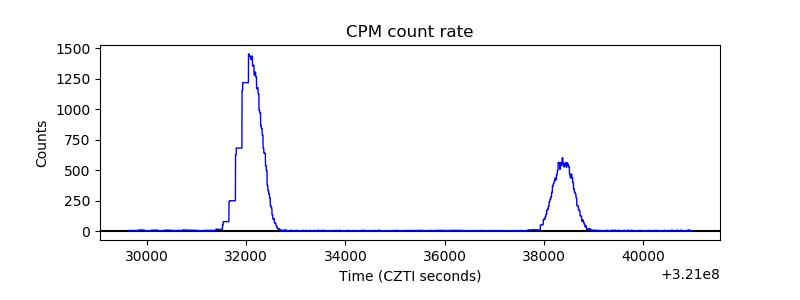 |
| CZT Counter | 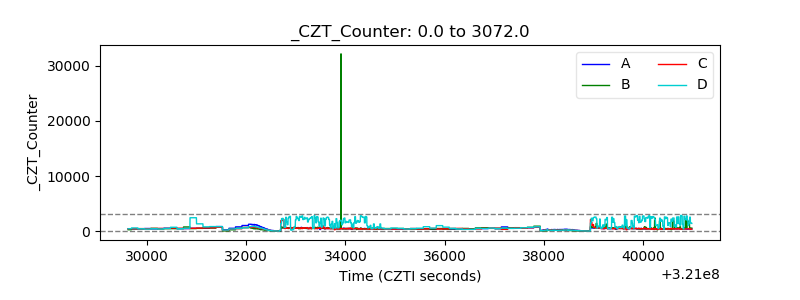 |
| +2.5 Volts monitor | 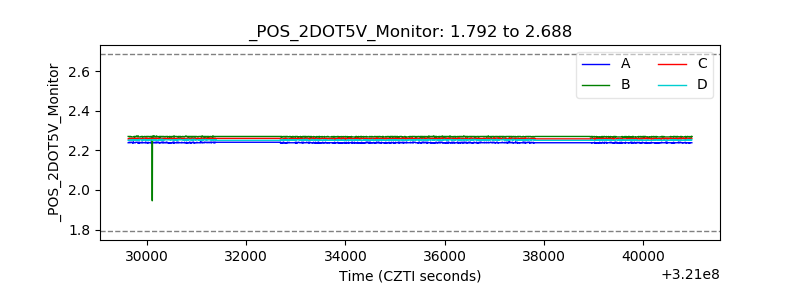 |
| +5 Volts monitor |  |
| _ROLL_ROT | 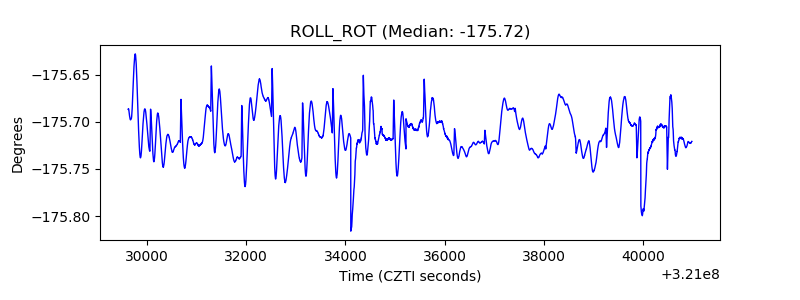 |
| _Roll_DEC | 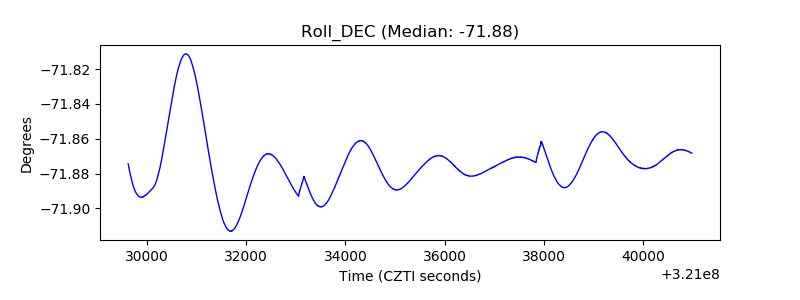 |
| _Roll_RA |  |
| Veto Counter | 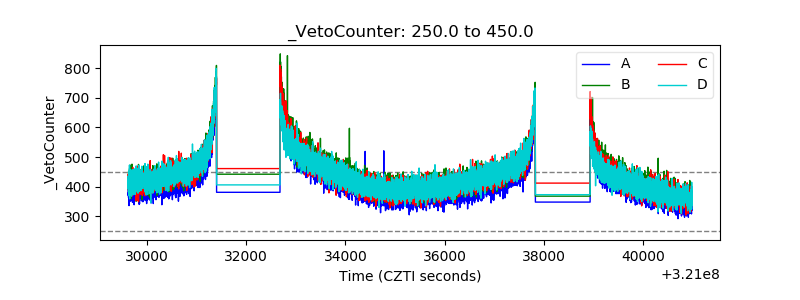 |