| Param | Original file | Final file |
|---|---|---|
| Filename | modeM0/AS1A07_001T03_9000003548cztM0_level2_bc.evt | modeM0/AS1A07_001T03_9000003548cztM0_level2_quad_clean.evt |
| Size (bytes) | 506,030,400 | 181,929,600 |
| Size | 482.6 MB | 173.5 MB |
| Events in quadrant A | 2,085,270 | 1,335,914 |
| Events in quadrant B | 2,133,471 | 1,340,074 |
| Events in quadrant C | 3,087,564 | 1,267,840 |
| Events in quadrant D | 7,406,361 | 948,922 |
| Mode SS | |||
|---|---|---|---|
| Quadrant | BADHDUFLAG | Total packets | Discarded packets |
| A | 0 | 180 | 0 |
| B | 0 | 180 | 0 |
| C | 0 | 180 | 0 |
| D | 0 | 180 | 0 |
| Mode M9 | |||
|---|---|---|---|
| Quadrant | BADHDUFLAG | Total packets | Discarded packets |
| A | 0 | 12 | 0 |
| B | 0 | 12 | 0 |
| C | 0 | 12 | 0 |
| D | 0 | 12 | 0 |
| Mode M0 | |||
|---|---|---|---|
| Quadrant | BADHDUFLAG | Total packets | Discarded packets |
| A | 0 | 18993 | 0 |
| B | 0 | 19067 | 0 |
| C | 0 | 22452 | 0 |
| D | 0 | 47725 | 0 |
| Quadrant | Total seconds | Saturated seconds | Saturation percentage |
|---|---|---|---|
| A | 8877 | 73 | 0.822350% |
| B | 8877 | 74 | 0.833615% |
| C | 8878 | 265 | 2.984907% |
| D | 8878 | 3849 | 43.354359% |
Noise dominated data is calculated using 1-second bins in cleaned event files. If a bin has >2000 counts, and if more than 50% of those come from <1% of pixels, then it is considered to be noise-dominated and hence unusable.
| Quadrant | # 1 sec bins | Bins with >0 counts | Bins with >2000 counts | High rate bins dominated by noise | Noise dominated (total time) | Noise dominated (detector-on time) | Marked lightcurve |
|---|---|---|---|---|---|---|---|
| A | 10062 | 8877 | 0 | 0 | 0.00% | 0.00% |  |
| B | 10062 | 8877 | 3 | 3 | 0.03% | 0.03% |  |
| C | 10063 | 8878 | 78 | 78 | 0.78% | 0.88% |  |
| D | 10063 | 8865 | 311 | 311 | 3.09% | 3.51% |  |
Top three noisy pixels from each quadrant. If the there are fewer than three noisy pixels in the level2.evt file, extra rows are filled as -1
| Pixel properties | Quadrant properties | ||||||
|---|---|---|---|---|---|---|---|
| Quadrant | DetID | PixID | Counts | Sigma | Mean | Median | Sigma |
| A | 13 | 254 | 14226 | 117.17 | 540 | 533 | 116.9 |
| A | 0 | 226 | 3559 | 25.89 | 540 | 533 | 116.9 |
| A | 12 | 194 | 3382 | 24.38 | 540 | 533 | 116.9 |
| B | 0 | 197 | 28358 | 274.5 | 537 | 529 | 101.4 |
| B | 5 | 172 | 11612 | 109.32 | 537 | 529 | 101.4 |
| B | 0 | 245 | 7867 | 72.38 | 537 | 529 | 101.4 |
| C | 0 | 239 | 1037445 | 8494.58 | 507 | 506 | 122.1 |
| C | 0 | 10 | 62570 | 508.43 | 507 | 506 | 122.1 |
| C | 7 | 221 | 33701 | 271.93 | 507 | 506 | 122.1 |
| D | 12 | 218 | 4482977 | 46167.29 | 405 | 392 | 97.1 |
| D | 2 | 82 | 528791 | 5442.12 | 405 | 392 | 97.1 |
| D | 8 | 195 | 350261 | 3603.39 | 405 | 392 | 97.1 |
Histogram calculated using DETX and DETY for each event in the final _common_clean file
| Quadrant A |  |
 |
Quadrant B |
|---|---|---|---|
| Quadrant D |  |
 |
Quadrant C |
| Plot type | Count rate plots | Images |
|---|---|---|
| Comparison with Poisson distribution Blue bars denote a histogram of data divided into 1 sec bins. Red curve is a Poisson curve with rate = median count rate of data. |
 |
 |
| Quadrant-wise count rates Data is divided into 100 sec bins |
 |
|
| Module-wise count rates for Quadrant A Data is divided into 100 sec bins |
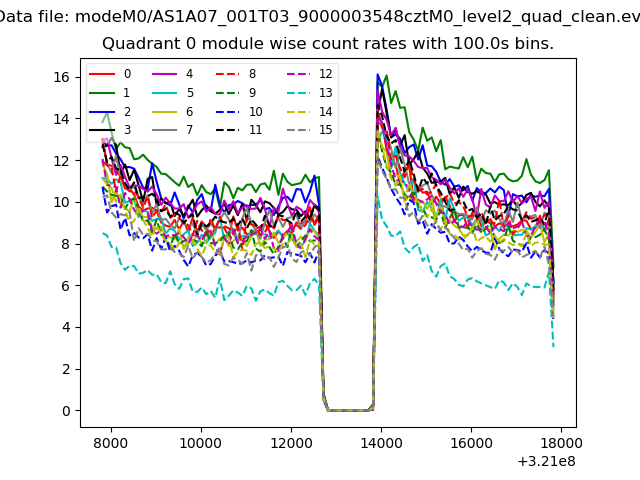 |
 |
| Module-wise count rates for Quadrant B Data is divided into 100 sec bins |
 |
 |
| Module-wise count rates for Quadrant C Data is divided into 100 sec bins |
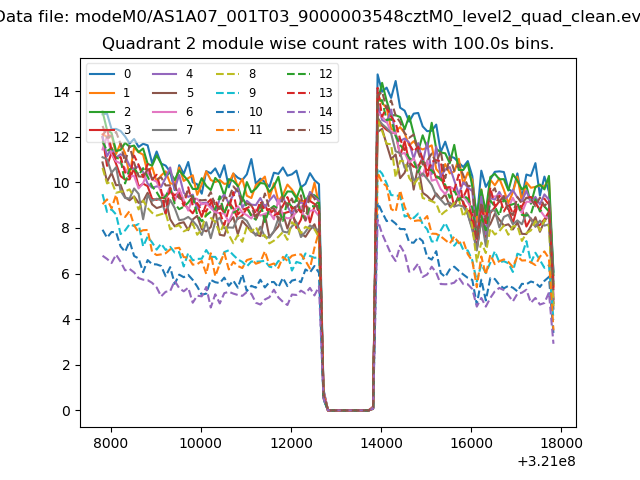 |
 |
| Module-wise count rates for Quadrant D Data is divided into 100 sec bins |
 |
 |
| Parameter | Plot |
|---|---|
| CZT HV Monitor |  |
| D_VDD |  |
| Temperature 1 |  |
| Veto HV Monitor |  |
| Veto LLD |  |
| Alpha Counter |  |
| _CPM_Rate |  |
| CZT Counter |  |
| +2.5 Volts monitor |  |
| +5 Volts monitor |  |
| _ROLL_ROT |  |
| _Roll_DEC |  |
| _Roll_RA |  |
| Veto Counter |  |