| Param | Original file | Final file |
|---|---|---|
| Filename | modeM0/AS1A07_001T02_9000003546cztM0_level2_bc.evt | modeM0/AS1A07_001T02_9000003546cztM0_level2_quad_clean.evt |
| Size (bytes) | 917,524,800 | 384,949,440 |
| Size | 875.0 MB | 367.1 MB |
| Events in quadrant A | 4,232,771 | 2,718,025 |
| Events in quadrant B | 4,471,952 | 2,746,646 |
| Events in quadrant C | 4,443,515 | 2,632,001 |
| Events in quadrant D | 13,194,173 | 2,109,715 |
| Mode M0 | |||
|---|---|---|---|
| Quadrant | BADHDUFLAG | Total packets | Discarded packets |
| A | 0 | 42906 | 0 |
| B | 0 | 43482 | 0 |
| C | 0 | 44163 | 0 |
| D | 0 | 89621 | 0 |
| Mode M9 | |||
|---|---|---|---|
| Quadrant | BADHDUFLAG | Total packets | Discarded packets |
| A | 0 | 27 | 0 |
| B | 0 | 27 | 0 |
| C | 0 | 27 | 0 |
| D | 0 | 27 | 0 |
| Mode SS | |||
|---|---|---|---|
| Quadrant | BADHDUFLAG | Total packets | Discarded packets |
| A | 0 | 432 | 0 |
| B | 0 | 432 | 0 |
| C | 0 | 432 | 0 |
| D | 0 | 432 | 0 |
| Quadrant | Total seconds | Saturated seconds | Saturation percentage |
|---|---|---|---|
| A | 21077 | 166 | 0.787588% |
| B | 21072 | 239 | 1.134207% |
| C | 21078 | 375 | 1.779106% |
| D | 21073 | 6095 | 28.923267% |
Noise dominated data is calculated using 1-second bins in cleaned event files. If a bin has >2000 counts, and if more than 50% of those come from <1% of pixels, then it is considered to be noise-dominated and hence unusable.
| Quadrant | # 1 sec bins | Bins with >0 counts | Bins with >2000 counts | High rate bins dominated by noise | Noise dominated (total time) | Noise dominated (detector-on time) | Marked lightcurve |
|---|---|---|---|---|---|---|---|
| A | 23939 | 21079 | 0 | 0 | 0.00% | 0.00% |  |
| B | 23939 | 21078 | 1 | 1 | 0.00% | 0.00% |  |
| C | 23939 | 21078 | 5 | 5 | 0.02% | 0.02% |  |
| D | 23939 | 20955 | 441 | 441 | 1.84% | 2.10% |  |
Top three noisy pixels from each quadrant. If the there are fewer than three noisy pixels in the level2.evt file, extra rows are filled as -1
| Pixel properties | Quadrant properties | ||||||
|---|---|---|---|---|---|---|---|
| Quadrant | DetID | PixID | Counts | Sigma | Mean | Median | Sigma |
| A | 13 | 254 | 32212 | 130.77 | 1091 | 1072 | 238.1 |
| A | 6 | 16 | 9011 | 33.34 | 1091 | 1072 | 238.1 |
| A | 0 | 226 | 6933 | 24.61 | 1091 | 1072 | 238.1 |
| B | 0 | 197 | 100238 | 473.83 | 1097 | 1073 | 209.3 |
| B | 6 | 36 | 32782 | 151.51 | 1097 | 1073 | 209.3 |
| B | 0 | 190 | 22423 | 102.01 | 1097 | 1073 | 209.3 |
| C | 0 | 239 | 215521 | 858.05 | 1048 | 1042 | 250.0 |
| C | 0 | 10 | 124117 | 492.38 | 1048 | 1042 | 250.0 |
| C | 7 | 247 | 38863 | 151.31 | 1048 | 1042 | 250.0 |
| D | 12 | 218 | 8137809 | 38460.46 | 891 | 859 | 211.6 |
| D | 2 | 82 | 519548 | 2451.66 | 891 | 859 | 211.6 |
| D | 8 | 195 | 432655 | 2040.95 | 891 | 859 | 211.6 |
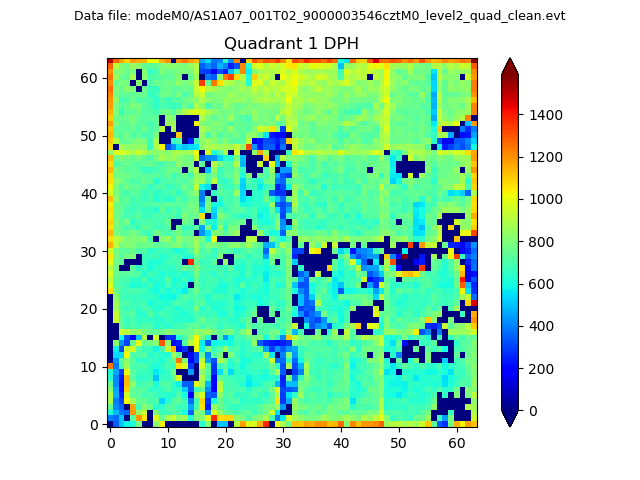
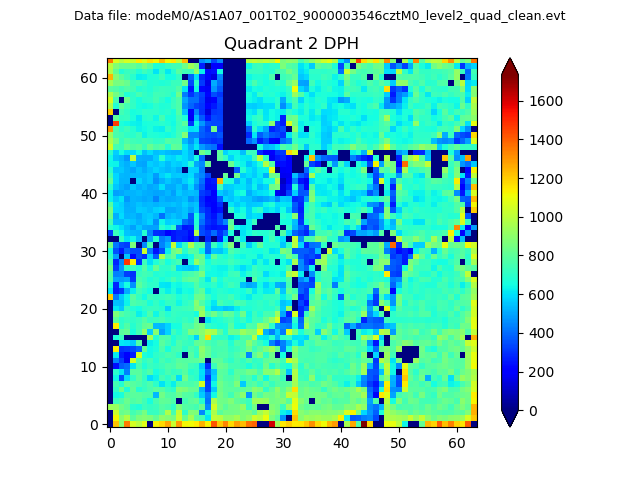
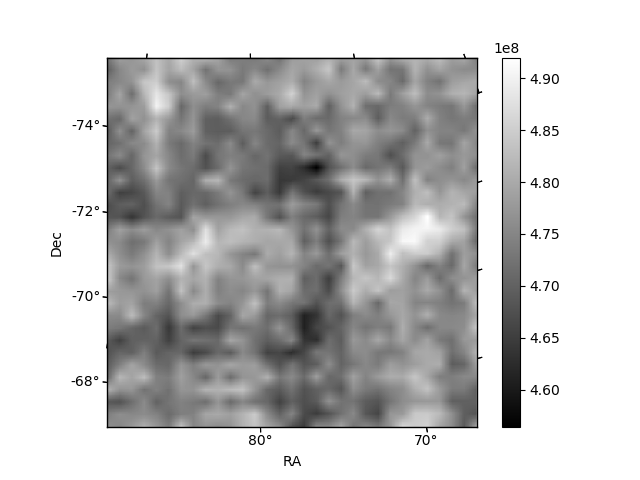
Histogram calculated using DETX and DETY for each event in the final _common_clean file
| Quadrant A |  |
 |
Quadrant B |
|---|---|---|---|
| Quadrant D |  |
 |
Quadrant C |
| Plot type | Count rate plots | Images |
|---|---|---|
| Comparison with Poisson distribution Blue bars denote a histogram of data divided into 1 sec bins. Red curve is a Poisson curve with rate = median count rate of data. |
 |
 |
| Quadrant-wise count rates Data is divided into 100 sec bins |
 |
|
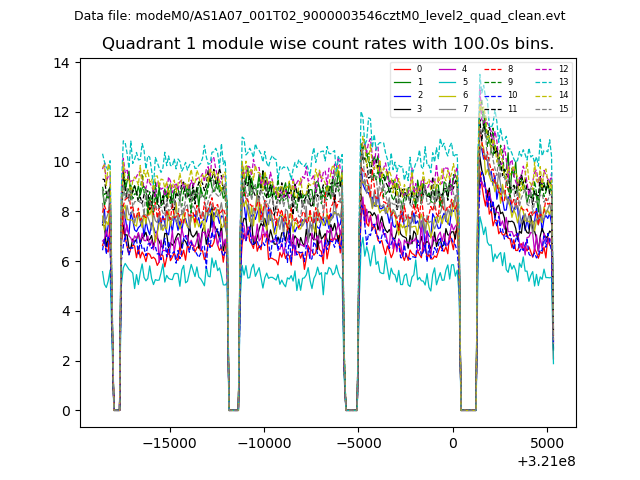
| Module-wise count rates for Quadrant A Data is divided into 100 sec bins |
 |
 |
| Module-wise count rates for Quadrant B Data is divided into 100 sec bins |
 |
 |
| Module-wise count rates for Quadrant C Data is divided into 100 sec bins |
 |
 |
| Module-wise count rates for Quadrant D Data is divided into 100 sec bins |
 |
 |
| Parameter | Plot |
|---|---|
| CZT HV Monitor | 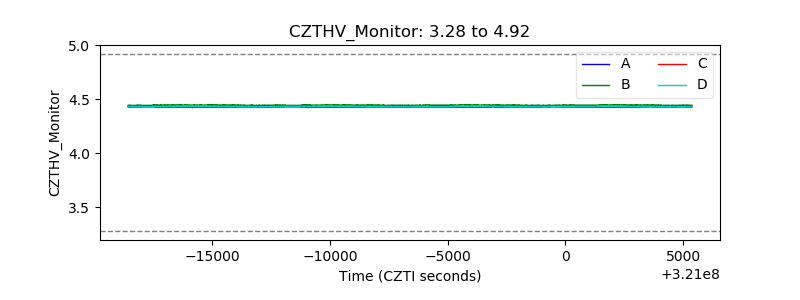 |
| D_VDD |  |
| Temperature 1 |  |
| Veto HV Monitor |  |
| Veto LLD | 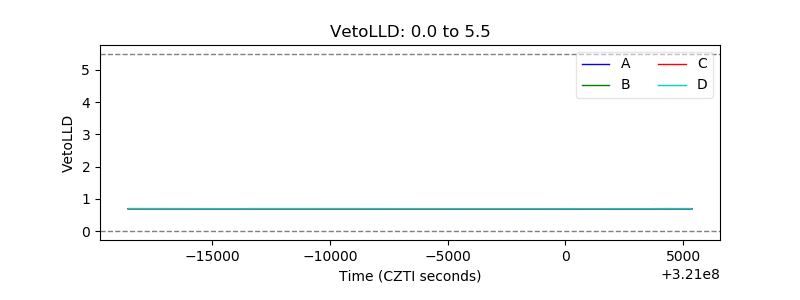 |
| Alpha Counter |  |
| _CPM_Rate | 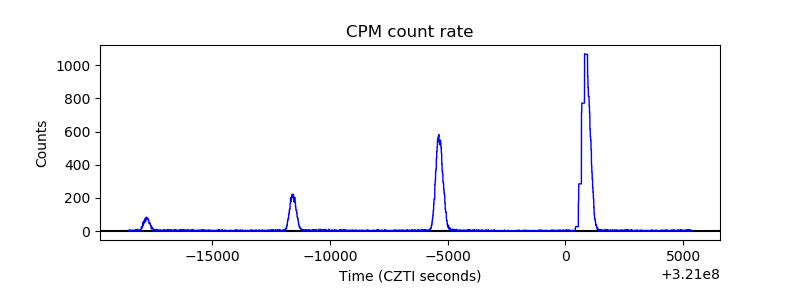 |
| CZT Counter |  |
| +2.5 Volts monitor | 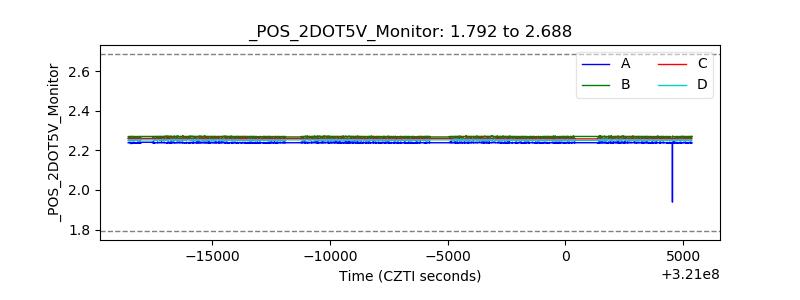 |
| +5 Volts monitor |  |
| _ROLL_ROT | 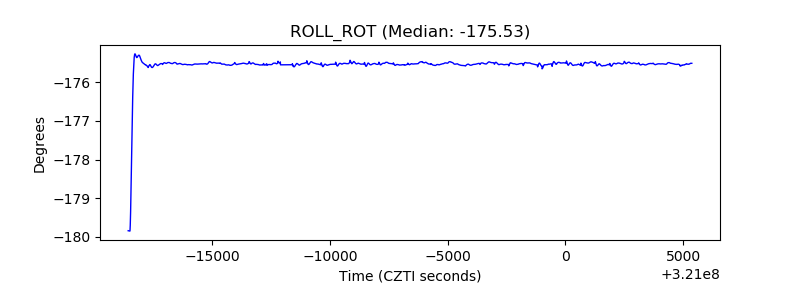 |
| _Roll_DEC | 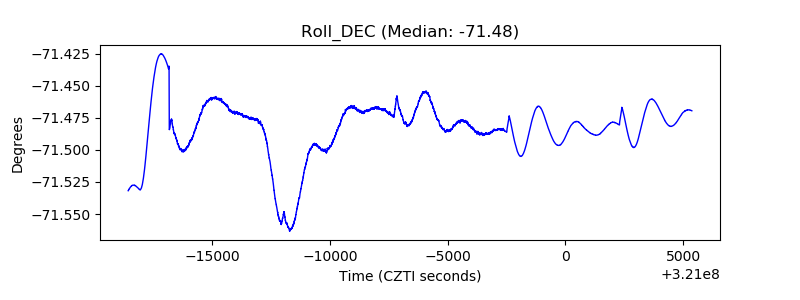 |
| _Roll_RA |  |
| Veto Counter |  |