| Param | Original file | Final file |
|---|---|---|
| Filename | modeM0/AS1C05_002T07_9000003542cztM0_level2_bc.evt | modeM0/AS1C05_002T07_9000003542cztM0_level2_quad_clean.evt |
| Size (bytes) | 313,666,560 | 92,352,960 |
| Size | 299.1 MB | 88.1 MB |
| Events in quadrant A | 1,692,268 | 565,595 |
| Events in quadrant B | 1,794,176 | 576,742 |
| Events in quadrant C | 1,766,344 | 552,397 |
| Events in quadrant D | 3,647,631 | 499,651 |
| Mode M9 | |||
|---|---|---|---|
| Quadrant | BADHDUFLAG | Total packets | Discarded packets |
| A | 0 | 6 | 0 |
| B | 0 | 6 | 0 |
| C | 0 | 6 | 0 |
| D | 0 | 6 | 0 |
| Mode SS | |||
|---|---|---|---|
| Quadrant | BADHDUFLAG | Total packets | Discarded packets |
| A | 0 | 176 | 0 |
| B | 0 | 176 | 0 |
| C | 0 | 176 | 0 |
| D | 0 | 176 | 0 |
| Mode M0 | |||
|---|---|---|---|
| Quadrant | BADHDUFLAG | Total packets | Discarded packets |
| A | 0 | 17520 | 0 |
| B | 0 | 17787 | 0 |
| C | 0 | 18016 | 0 |
| D | 0 | 27247 | 0 |
| Quadrant | Total seconds | Saturated seconds | Saturation percentage |
|---|---|---|---|
| A | 8669 | 50 | 0.576768% |
| B | 8669 | 68 | 0.784404% |
| C | 8669 | 122 | 1.407313% |
| D | 8669 | 1105 | 12.746568% |
Noise dominated data is calculated using 1-second bins in cleaned event files. If a bin has >2000 counts, and if more than 50% of those come from <1% of pixels, then it is considered to be noise-dominated and hence unusable.
| Quadrant | # 1 sec bins | Bins with >0 counts | Bins with >2000 counts | High rate bins dominated by noise | Noise dominated (total time) | Noise dominated (detector-on time) | Marked lightcurve |
|---|---|---|---|---|---|---|---|
| A | 9269 | 8669 | 0 | 0 | 0.00% | 0.00% |  |
| B | 9269 | 8669 | 1 | 1 | 0.01% | 0.01% |  |
| C | 9269 | 8669 | 1 | 1 | 0.01% | 0.01% |  |
| D | 9269 | 8661 | 46 | 46 | 0.50% | 0.53% | 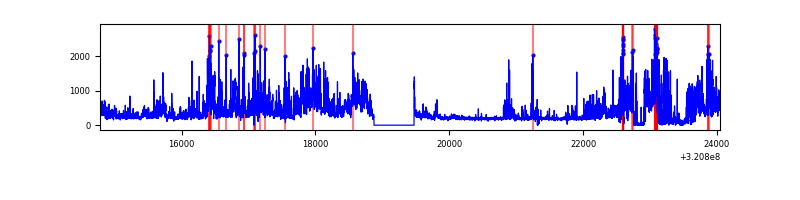 |
Top three noisy pixels from each quadrant. If the there are fewer than three noisy pixels in the level2.evt file, extra rows are filled as -1
| Pixel properties | Quadrant properties | ||||||
|---|---|---|---|---|---|---|---|
| Quadrant | DetID | PixID | Counts | Sigma | Mean | Median | Sigma |
| A | 13 | 254 | 11284 | 111.68 | 436 | 427 | 97.2 |
| A | 2 | 250 | 5842 | 55.7 | 436 | 427 | 97.2 |
| A | 0 | 31 | 3002 | 26.49 | 436 | 427 | 97.2 |
| B | 0 | 190 | 27473 | 311.02 | 440 | 429 | 87.0 |
| B | 3 | 64 | 21788 | 245.64 | 440 | 429 | 87.0 |
| B | 0 | 189 | 17070 | 191.38 | 440 | 429 | 87.0 |
| C | 3 | 233 | 117695 | 1177.17 | 417 | 413 | 99.6 |
| C | 0 | 10 | 29998 | 296.95 | 417 | 413 | 99.6 |
| C | 7 | 247 | 9620 | 92.41 | 417 | 413 | 99.6 |
| D | 8 | 195 | 1049306 | 11185.15 | 392 | 377 | 93.8 |
| D | 12 | 218 | 745036 | 7940.6 | 392 | 377 | 93.8 |
| D | 1 | 52 | 298424 | 3178.2 | 392 | 377 | 93.8 |
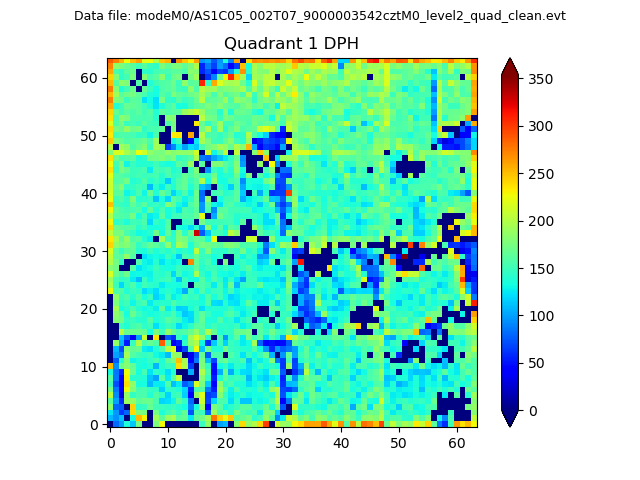
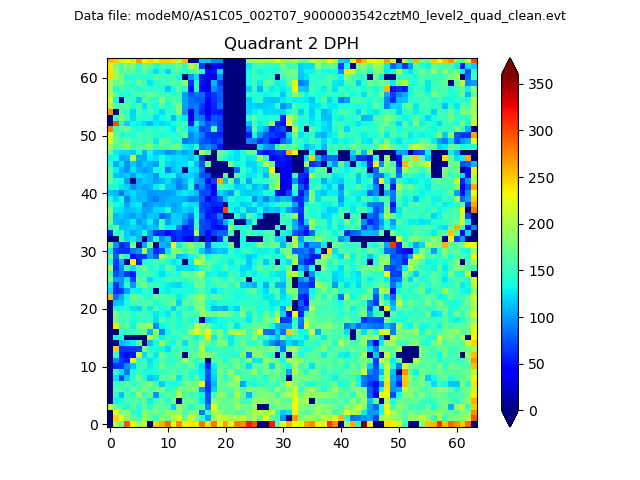
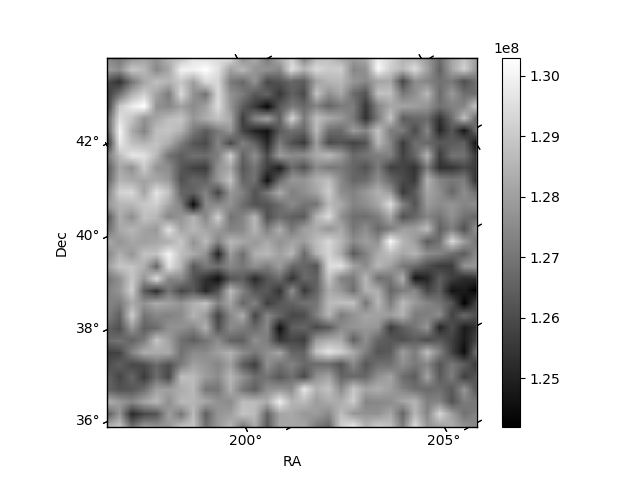
Histogram calculated using DETX and DETY for each event in the final _common_clean file
| Quadrant A |  |
 |
Quadrant B |
|---|---|---|---|
| Quadrant D |  |
 |
Quadrant C |
| Plot type | Count rate plots | Images |
|---|---|---|
| Comparison with Poisson distribution Blue bars denote a histogram of data divided into 1 sec bins. Red curve is a Poisson curve with rate = median count rate of data. |
 |
 |
| Quadrant-wise count rates Data is divided into 100 sec bins |
 |
|
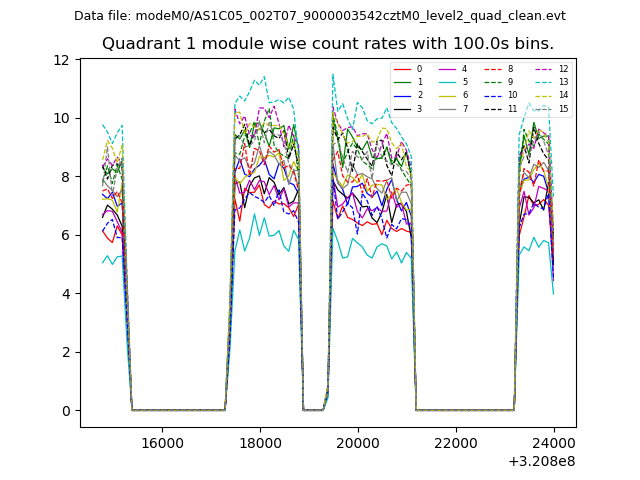
| Module-wise count rates for Quadrant A Data is divided into 100 sec bins |
 |
 |
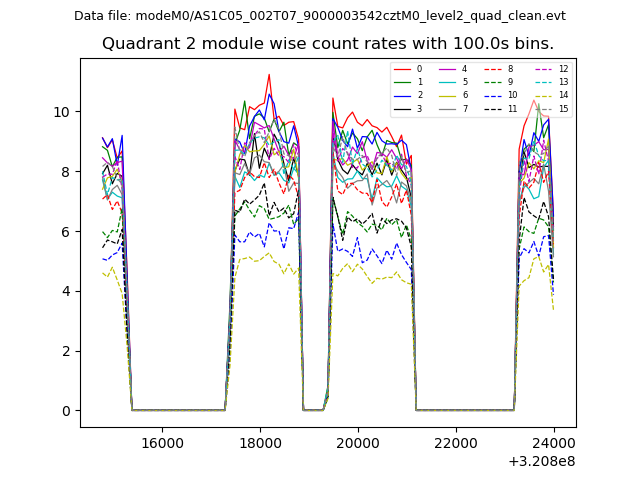
| Module-wise count rates for Quadrant B Data is divided into 100 sec bins |
 |
 |
| Module-wise count rates for Quadrant C Data is divided into 100 sec bins |
 |
 |
| Module-wise count rates for Quadrant D Data is divided into 100 sec bins |
 |
 |
| Parameter | Plot |
|---|---|
| CZT HV Monitor |  |
| D_VDD | 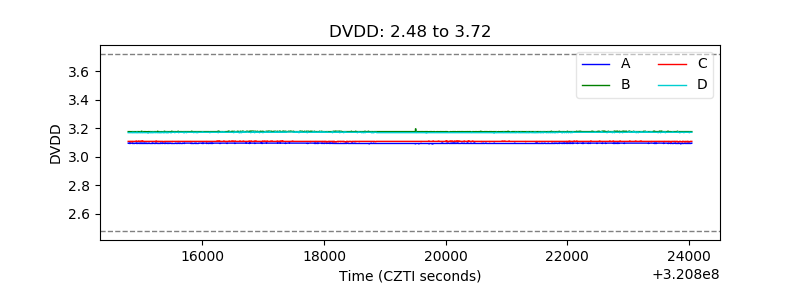 |
| Temperature 1 |  |
| Veto HV Monitor | 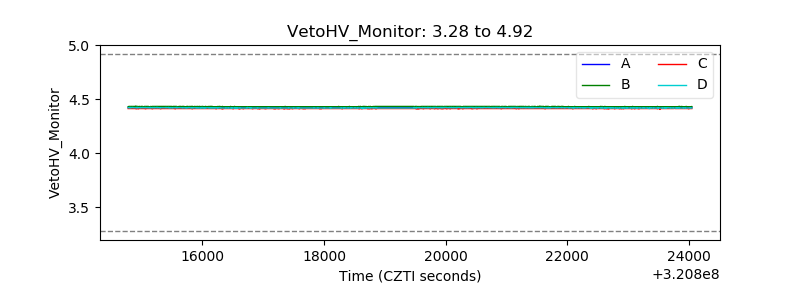 |
| Veto LLD |  |
| Alpha Counter |  |
| _CPM_Rate |  |
| CZT Counter |  |
| +2.5 Volts monitor |  |
| +5 Volts monitor |  |
| _ROLL_ROT |  |
| _Roll_DEC |  |
| _Roll_RA |  |
| Veto Counter | 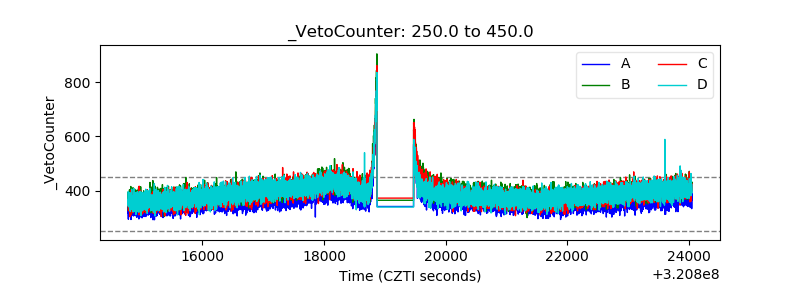 |