| Param | Original file | Final file |
|---|---|---|
| Filename | modeM0/AS1A07_101T02_9000003544cztM0_level2_bc.evt | modeM0/AS1A07_101T02_9000003544cztM0_level2_quad_clean.evt |
| Size (bytes) | 5,644,961,280 | 1,762,073,280 |
| Size | 5.3 GB | 1.6 GB |
| Events in quadrant A | 28,105,601 | 11,422,841 |
| Events in quadrant B | 32,305,316 | 11,550,592 |
| Events in quadrant C | 28,559,098 | 11,226,426 |
| Events in quadrant D | 73,190,353 | 10,316,192 |
| Mode SS | |||
|---|---|---|---|
| Quadrant | BADHDUFLAG | Total packets | Discarded packets |
| A | 0 | 2642 | 0 |
| B | 0 | 2642 | 0 |
| C | 0 | 2642 | 0 |
| D | 0 | 2642 | 0 |
| Mode M0 | |||
|---|---|---|---|
| Quadrant | BADHDUFLAG | Total packets | Discarded packets |
| A | 0 | 271605 | 0 |
| B | 0 | 287308 | 0 |
| C | 0 | 276645 | 0 |
| D | 0 | 461342 | 0 |
| Mode M9 | |||
|---|---|---|---|
| Quadrant | BADHDUFLAG | Total packets | Discarded packets |
| A | 0 | 208 | 0 |
| B | 0 | 208 | 0 |
| C | 0 | 208 | 0 |
| D | 0 | 208 | 0 |
| Quadrant | Total seconds | Saturated seconds | Saturation percentage |
|---|---|---|---|
| A | 129200 | 1354 | 1.047988% |
| B | 129199 | 2566 | 1.986083% |
| C | 129199 | 2529 | 1.957445% |
| D | 129201 | 21196 | 16.405446% |
Noise dominated data is calculated using 1-second bins in cleaned event files. If a bin has >2000 counts, and if more than 50% of those come from <1% of pixels, then it is considered to be noise-dominated and hence unusable.
| Quadrant | # 1 sec bins | Bins with >0 counts | Bins with >2000 counts | High rate bins dominated by noise | Noise dominated (total time) | Noise dominated (detector-on time) | Marked lightcurve |
|---|---|---|---|---|---|---|---|
| A | 155416 | 129213 | 0 | 0 | 0.00% | 0.00% |  |
| B | 155416 | 129209 | 86 | 86 | 0.06% | 0.07% | 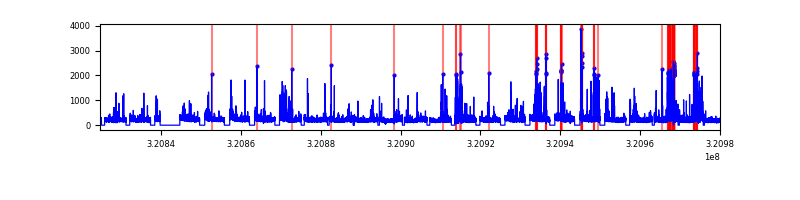 |
| C | 155416 | 129210 | 46 | 46 | 0.03% | 0.04% |  |
| D | 155416 | 128857 | 3033 | 3033 | 1.95% | 2.35% |  |
Top three noisy pixels from each quadrant. If the there are fewer than three noisy pixels in the level2.evt file, extra rows are filled as -1
| Pixel properties | Quadrant properties | ||||||
|---|---|---|---|---|---|---|---|
| Quadrant | DetID | PixID | Counts | Sigma | Mean | Median | Sigma |
| A | 13 | 254 | 188123 | 117.44 | 7226 | 7116 | 1541.3 |
| A | 14 | 111 | 123950 | 75.8 | 7226 | 7116 | 1541.3 |
| A | 2 | 250 | 73616 | 43.15 | 7226 | 7116 | 1541.3 |
| B | 3 | 64 | 3084120 | 2300.25 | 7233 | 7079 | 1337.7 |
| B | 0 | 197 | 583214 | 430.69 | 7233 | 7079 | 1337.7 |
| B | 0 | 189 | 379311 | 278.26 | 7233 | 7079 | 1337.7 |
| C | 0 | 10 | 842410 | 514.76 | 6962 | 6962 | 1623.0 |
| C | 10 | 9 | 614949 | 374.61 | 6962 | 6962 | 1623.0 |
| C | 0 | 239 | 177959 | 105.36 | 6962 | 6962 | 1623.0 |
| D | 12 | 218 | 27171136 | 18084.37 | 6515 | 6312 | 1502.1 |
| D | 8 | 195 | 8982565 | 5975.74 | 6515 | 6312 | 1502.1 |
| D | 1 | 52 | 7958206 | 5293.79 | 6515 | 6312 | 1502.1 |
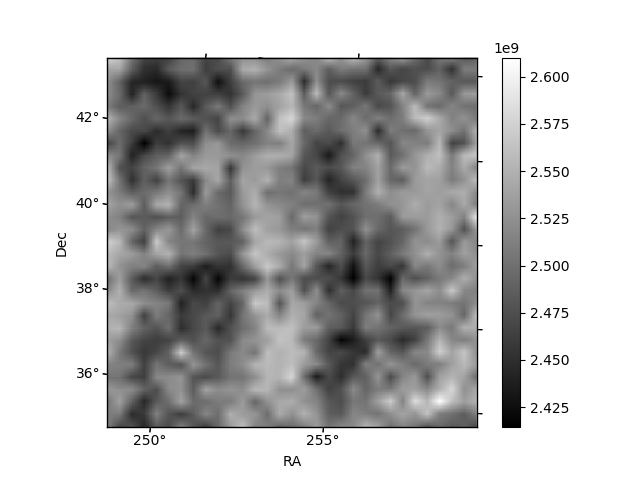
Histogram calculated using DETX and DETY for each event in the final _common_clean file
| Quadrant A | 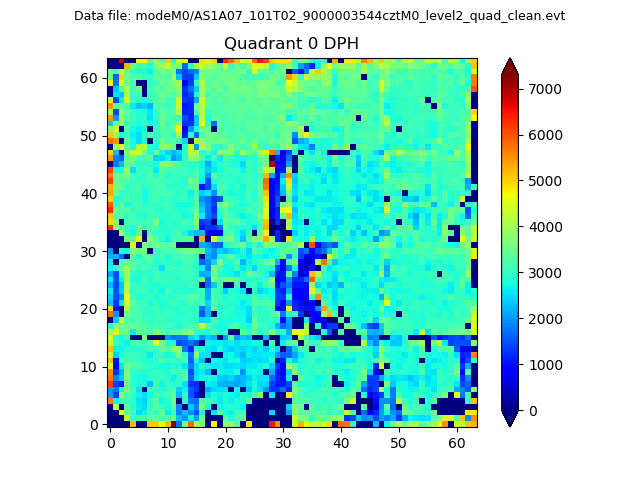 |
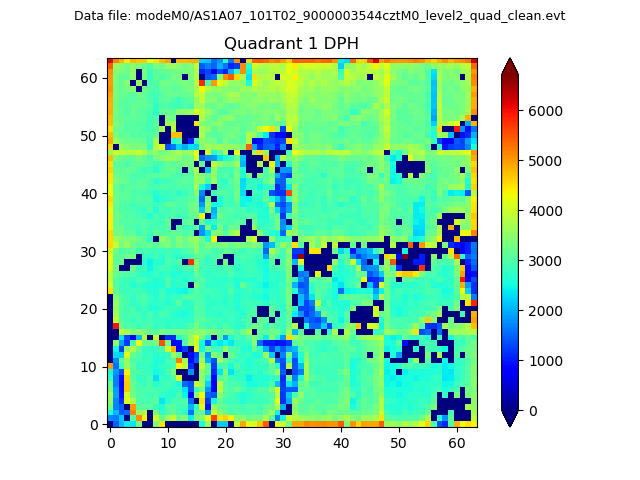 |
Quadrant B |
|---|---|---|---|
| Quadrant D |  |
 |
Quadrant C |
| Plot type | Count rate plots | Images |
|---|---|---|
| Comparison with Poisson distribution Blue bars denote a histogram of data divided into 1 sec bins. Red curve is a Poisson curve with rate = median count rate of data. |
 |
 |
| Quadrant-wise count rates Data is divided into 100 sec bins |
 |
|
| Module-wise count rates for Quadrant A Data is divided into 100 sec bins |
 |
 |
| Module-wise count rates for Quadrant B Data is divided into 100 sec bins |
 |
 |
| Module-wise count rates for Quadrant C Data is divided into 100 sec bins |
 |
 |
| Module-wise count rates for Quadrant D Data is divided into 100 sec bins |
 |
 |
| Parameter | Plot |
|---|---|
| CZT HV Monitor | 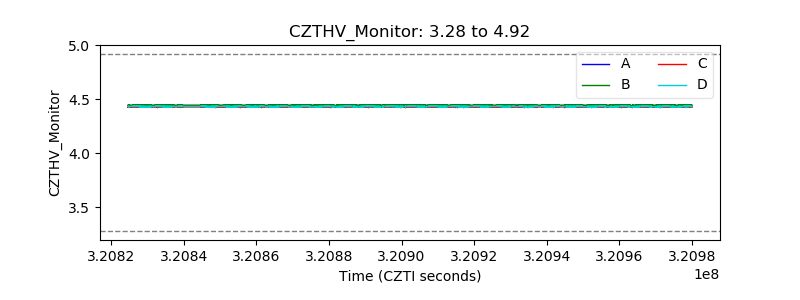 |
| D_VDD |  |
| Temperature 1 |  |
| Veto HV Monitor |  |
| Veto LLD |  |
| Alpha Counter |  |
| _CPM_Rate |  |
| CZT Counter |  |
| +2.5 Volts monitor |  |
| +5 Volts monitor |  |
| _ROLL_ROT |  |
| _Roll_DEC |  |
| _Roll_RA |  |
| Veto Counter | 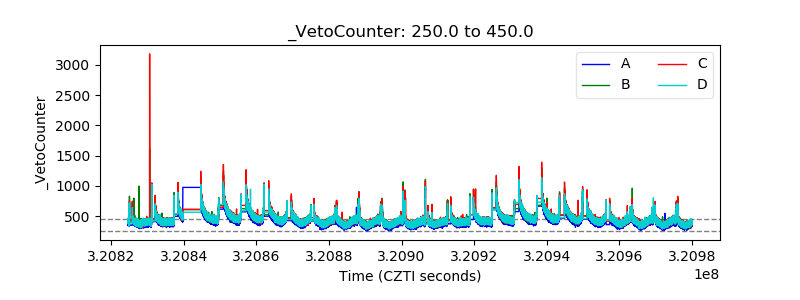 |