| Param | Original file | Final file |
|---|---|---|
| Filename | modeM0/AS1C05_002T07_9000003536cztM0_level2_bc.evt | modeM0/AS1C05_002T07_9000003536cztM0_level2_quad_clean.evt |
| Size (bytes) | 238,006,080 | 110,171,520 |
| Size | 227.0 MB | 105.1 MB |
| Events in quadrant A | 1,484,272 | 732,915 |
| Events in quadrant B | 1,549,517 | 750,712 |
| Events in quadrant C | 1,628,721 | 720,096 |
| Events in quadrant D | 2,119,896 | 704,949 |
| Mode M0 | |||
|---|---|---|---|
| Quadrant | BADHDUFLAG | Total packets | Discarded packets |
| A | 0 | 13655 | 0 |
| B | 0 | 13971 | 0 |
| C | 0 | 14385 | 0 |
| D | 0 | 15399 | 0 |
| Mode M9 | |||
|---|---|---|---|
| Quadrant | BADHDUFLAG | Total packets | Discarded packets |
| A | 0 | 18 | 0 |
| B | 0 | 18 | 0 |
| C | 0 | 18 | 0 |
| D | 0 | 18 | 0 |
| Mode SS | |||
|---|---|---|---|
| Quadrant | BADHDUFLAG | Total packets | Discarded packets |
| A | 0 | 126 | 0 |
| B | 0 | 126 | 0 |
| C | 0 | 126 | 0 |
| D | 0 | 126 | 0 |
| Quadrant | Total seconds | Saturated seconds | Saturation percentage |
|---|---|---|---|
| A | 6136 | 158 | 2.574967% |
| B | 6136 | 182 | 2.966102% |
| C | 6136 | 252 | 4.106910% |
| D | 6136 | 165 | 2.689048% |
Noise dominated data is calculated using 1-second bins in cleaned event files. If a bin has >2000 counts, and if more than 50% of those come from <1% of pixels, then it is considered to be noise-dominated and hence unusable.
| Quadrant | # 1 sec bins | Bins with >0 counts | Bins with >2000 counts | High rate bins dominated by noise | Noise dominated (total time) | Noise dominated (detector-on time) | Marked lightcurve |
|---|---|---|---|---|---|---|---|
| A | 7491 | 6136 | 0 | 0 | 0.00% | 0.00% |  |
| B | 7491 | 6137 | 0 | 0 | 0.00% | 0.00% |  |
| C | 7491 | 6136 | 0 | 0 | 0.00% | 0.00% | 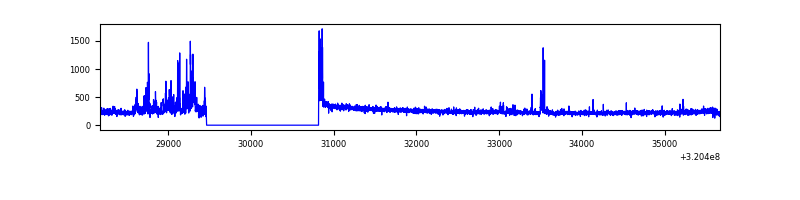 |
| D | 7491 | 6136 | 2 | 2 | 0.03% | 0.03% |  |
Top three noisy pixels from each quadrant. If the there are fewer than three noisy pixels in the level2.evt file, extra rows are filled as -1
| Pixel properties | Quadrant properties | ||||||
|---|---|---|---|---|---|---|---|
| Quadrant | DetID | PixID | Counts | Sigma | Mean | Median | Sigma |
| A | 13 | 254 | 9365 | 108.44 | 383 | 376 | 82.9 |
| A | 4 | 2 | 5968 | 67.46 | 383 | 376 | 82.9 |
| A | 2 | 250 | 3247 | 34.63 | 383 | 376 | 82.9 |
| B | 0 | 189 | 53164 | 707.9 | 388 | 380 | 74.6 |
| B | 0 | 245 | 5834 | 73.15 | 388 | 380 | 74.6 |
| B | 4 | 216 | 5139 | 63.82 | 388 | 380 | 74.6 |
| C | 7 | 247 | 138997 | 1568.38 | 372 | 371 | 88.4 |
| C | 0 | 10 | 55913 | 628.39 | 372 | 371 | 88.4 |
| C | 1 | 16 | 5825 | 61.71 | 372 | 371 | 88.4 |
| D | 8 | 195 | 542783 | 6215.0 | 380 | 368 | 87.3 |
| D | 9 | 35 | 48372 | 550.03 | 380 | 368 | 87.3 |
| D | 1 | 52 | 46935 | 533.57 | 380 | 368 | 87.3 |
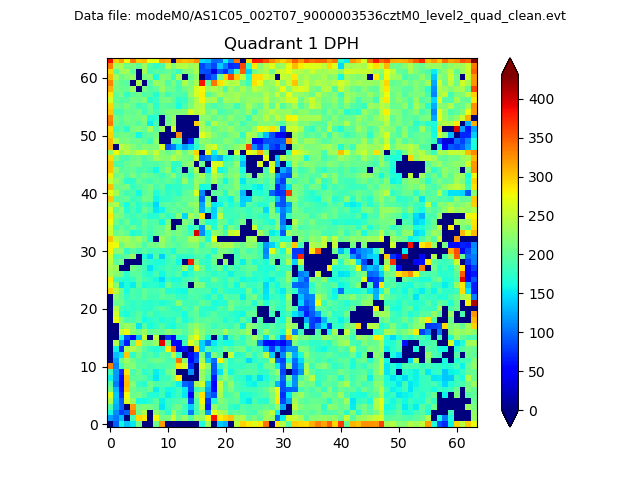
Histogram calculated using DETX and DETY for each event in the final _common_clean file
| Quadrant A |  |
 |
Quadrant B |
|---|---|---|---|
| Quadrant D |  |
 |
Quadrant C |
| Plot type | Count rate plots | Images |
|---|---|---|
| Comparison with Poisson distribution Blue bars denote a histogram of data divided into 1 sec bins. Red curve is a Poisson curve with rate = median count rate of data. |
 |
 |
| Quadrant-wise count rates Data is divided into 100 sec bins |
 |
|
| Module-wise count rates for Quadrant A Data is divided into 100 sec bins |
 |
 |
| Module-wise count rates for Quadrant B Data is divided into 100 sec bins |
 |
 |
| Module-wise count rates for Quadrant C Data is divided into 100 sec bins |
 |
 |
| Module-wise count rates for Quadrant D Data is divided into 100 sec bins |
 |
 |
| Parameter | Plot |
|---|---|
| CZT HV Monitor |  |
| D_VDD |  |
| Temperature 1 |  |
| Veto HV Monitor |  |
| Veto LLD |  |
| Alpha Counter |  |
| _CPM_Rate |  |
| CZT Counter | 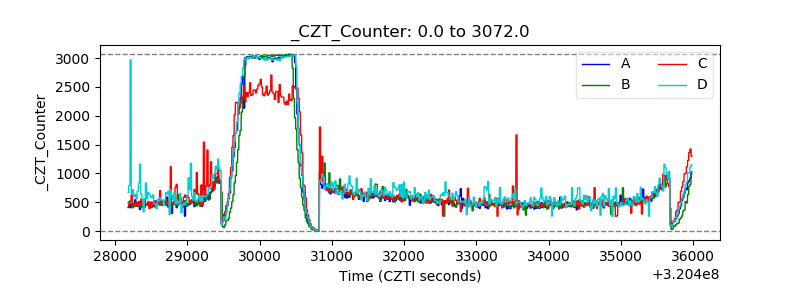 |
| +2.5 Volts monitor |  |
| +5 Volts monitor |  |
| _ROLL_ROT |  |
| _Roll_DEC |  |
| _Roll_RA |  |
| Veto Counter |  |