| Param | Original file | Final file |
|---|---|---|
| Filename | modeM0/AS1A07_027T03_9000003528cztM0_level2_bc.evt | modeM0/AS1A07_027T03_9000003528cztM0_level2_quad_clean.evt |
| Size (bytes) | 1,760,472,000 | 513,607,680 |
| Size | 1.6 GB | 489.8 MB |
| Events in quadrant A | 8,024,417 | 3,356,337 |
| Events in quadrant B | 8,520,612 | 3,412,700 |
| Events in quadrant C | 9,411,836 | 3,236,425 |
| Events in quadrant D | 24,822,823 | 2,992,315 |
| Mode SS | |||
|---|---|---|---|
| Quadrant | BADHDUFLAG | Total packets | Discarded packets |
| A | 0 | 758 | 0 |
| B | 0 | 758 | 0 |
| C | 0 | 758 | 0 |
| D | 0 | 758 | 0 |
| Mode M0 | |||
|---|---|---|---|
| Quadrant | BADHDUFLAG | Total packets | Discarded packets |
| A | 0 | 77543 | 0 |
| B | 0 | 79213 | 0 |
| C | 0 | 82931 | 0 |
| D | 0 | 133987 | 0 |
| Mode M9 | |||
|---|---|---|---|
| Quadrant | BADHDUFLAG | Total packets | Discarded packets |
| A | 0 | 72 | 0 |
| B | 0 | 72 | 0 |
| C | 0 | 72 | 0 |
| D | 0 | 72 | 0 |
| Quadrant | Total seconds | Saturated seconds | Saturation percentage |
|---|---|---|---|
| A | 37254 | 256 | 0.687175% |
| B | 37254 | 486 | 1.304558% |
| C | 37254 | 864 | 2.319214% |
| D | 37254 | 2717 | 7.293177% |
Noise dominated data is calculated using 1-second bins in cleaned event files. If a bin has >2000 counts, and if more than 50% of those come from <1% of pixels, then it is considered to be noise-dominated and hence unusable.
| Quadrant | # 1 sec bins | Bins with >0 counts | Bins with >2000 counts | High rate bins dominated by noise | Noise dominated (total time) | Noise dominated (detector-on time) | Marked lightcurve |
|---|---|---|---|---|---|---|---|
| A | 44404 | 37258 | 0 | 0 | 0.00% | 0.00% |  |
| B | 44404 | 37257 | 3 | 3 | 0.01% | 0.01% |  |
| C | 44404 | 37257 | 19 | 19 | 0.04% | 0.05% |  |
| D | 44404 | 37255 | 237 | 237 | 0.53% | 0.64% | 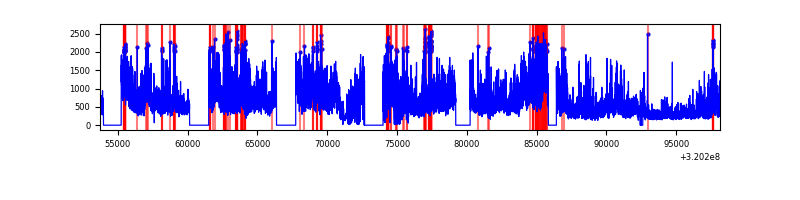 |
Top three noisy pixels from each quadrant. If the there are fewer than three noisy pixels in the level2.evt file, extra rows are filled as -1
| Pixel properties | Quadrant properties | ||||||
|---|---|---|---|---|---|---|---|
| Quadrant | DetID | PixID | Counts | Sigma | Mean | Median | Sigma |
| A | 13 | 254 | 62070 | 133.5 | 2072 | 2038 | 449.7 |
| A | 0 | 226 | 13392 | 25.25 | 2072 | 2038 | 449.7 |
| A | 12 | 194 | 12854 | 24.05 | 2072 | 2038 | 449.7 |
| B | 3 | 64 | 230864 | 580.07 | 2096 | 2050 | 394.5 |
| B | 0 | 189 | 36076 | 86.26 | 2096 | 2050 | 394.5 |
| B | 0 | 245 | 35422 | 84.6 | 2096 | 2050 | 394.5 |
| C | 0 | 10 | 766583 | 1651.29 | 1978 | 1973 | 463.0 |
| C | 0 | 207 | 528986 | 1138.16 | 1978 | 1973 | 463.0 |
| C | 0 | 239 | 399125 | 857.71 | 1978 | 1973 | 463.0 |
| D | 8 | 195 | 12048047 | 26663.06 | 1953 | 1888 | 451.8 |
| D | 1 | 52 | 4065329 | 8994.05 | 1953 | 1888 | 451.8 |
| D | 13 | 174 | 566935 | 1250.68 | 1953 | 1888 | 451.8 |
Histogram calculated using DETX and DETY for each event in the final _common_clean file
| Quadrant A |  |
 |
Quadrant B |
|---|---|---|---|
| Quadrant D |  |
 |
Quadrant C |
| Plot type | Count rate plots | Images |
|---|---|---|
| Comparison with Poisson distribution Blue bars denote a histogram of data divided into 1 sec bins. Red curve is a Poisson curve with rate = median count rate of data. |
 |
 |
| Quadrant-wise count rates Data is divided into 100 sec bins |
 |
|
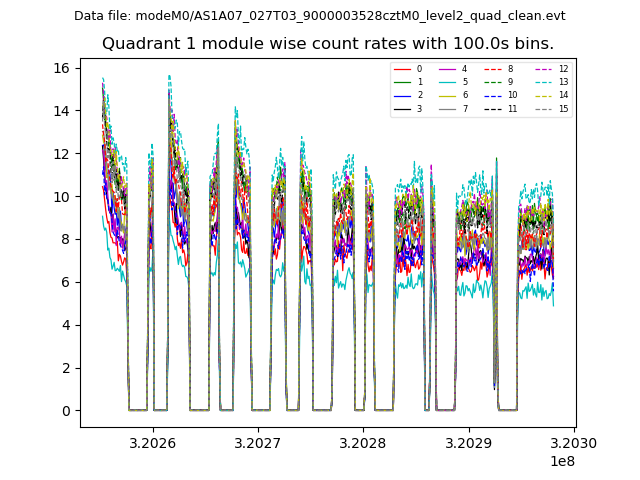
| Module-wise count rates for Quadrant A Data is divided into 100 sec bins |
 |
 |
| Module-wise count rates for Quadrant B Data is divided into 100 sec bins |
 |
 |
| Module-wise count rates for Quadrant C Data is divided into 100 sec bins |
 |
 |
| Module-wise count rates for Quadrant D Data is divided into 100 sec bins |
 |
 |
| Parameter | Plot |
|---|---|
| CZT HV Monitor |  |
| D_VDD |  |
| Temperature 1 |  |
| Veto HV Monitor | 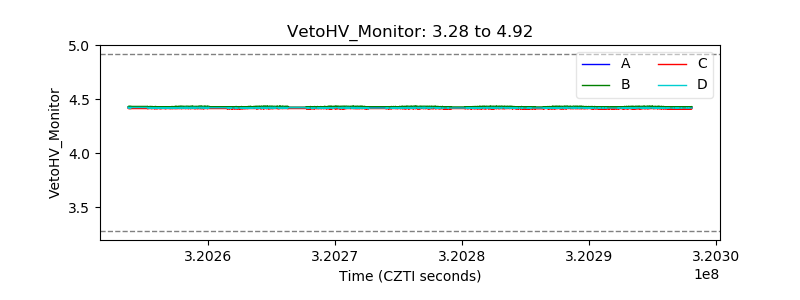 |
| Veto LLD |  |
| Alpha Counter | 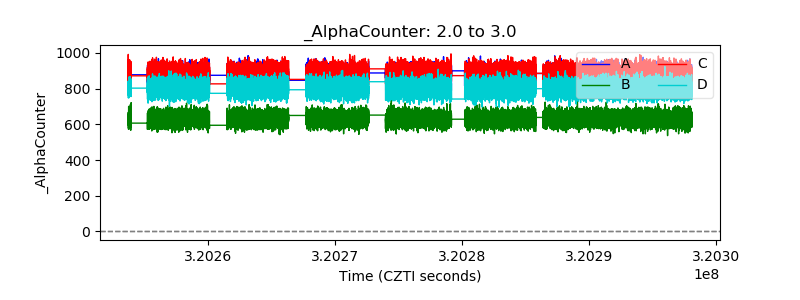 |
| _CPM_Rate |  |
| CZT Counter |  |
| +2.5 Volts monitor |  |
| +5 Volts monitor |  |
| _ROLL_ROT |  |
| _Roll_DEC | 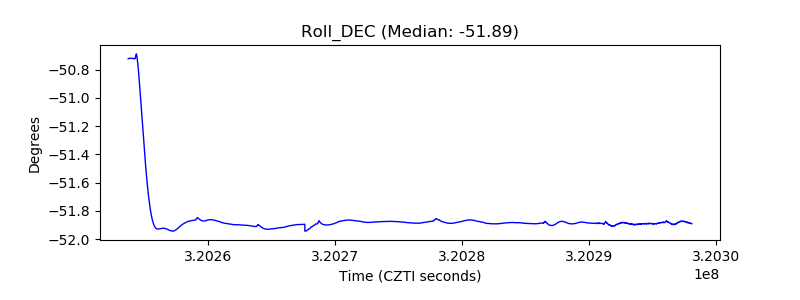 |
| _Roll_RA | 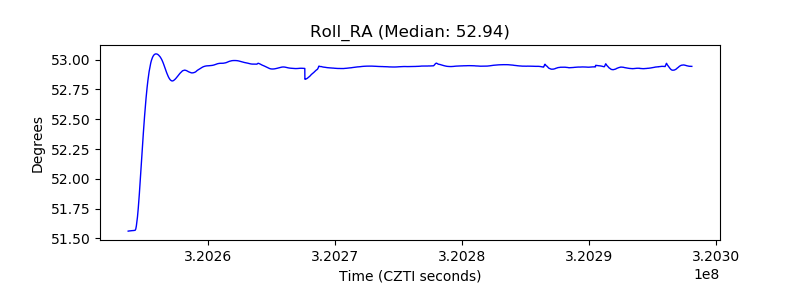 |
| Veto Counter |  |